
Once upon a time, a few clicks back into my youth from now, I fancied myself a fairly decent piano player. That illusion came to an abrupt demise when I met Fred Johnson. On the surface, Fred was as milquetoast-Midwestern as they come. You might have expected hay to fly out of his mouth when he spoke. But, that assessment would have been seriously flawed, as I soon learned. It turns outs that Fred was blessed with perfect pitch, had any number of the very long and complex Rachmaninoff and Prokofiev concertos perfectly lodged in memory, and the speed of someone afflicted with the gift of 25 fingers – and all by the 9th grade. He was a quintessential virtuoso as far as I was concerned. What Fred produced at the same piano and with a quick glance at the same sheet music as I had been laboring over for weeks were two entirely different definitions of music. In short, I would need to discover my own virtuosity away from the ivories from then on out.
Anyway, if you are experiencing a déjà vu moment with thoughts of Jim Collins’ 2001 bestseller “Good to Great” where the message was to get the right people in the right seats on the proverbial “bus,” then you would be simpatico with where I am headed with the following thoughts:
In a prior post, entitled “#TechnologyVolatility” (October 27, 2015), we introduced the rather propellerhead-ish concept that the standard deviation of technology spending per employee (TPE) over time – in this case, the 10 years from 2005 to 2014 – yields “TPE dispersion”. To simplify this mouthful, we call this number T-VOL™. It’s a techno-operational analytic that we believe provides insights into the functioning of an enterprise (or business unit, since the analysis has “fractal” qualities).
Not to go too much further into the weeds on this, but on the back of that post a client asked about the relationship between T-VOL and revenue per employee (RPE). Great question – and we thought it was well worth the exploration. In the exhibit below, revenue and technology spending represent the highest correlation (0.92) among the key variables – which is slightly higher than the correlation between headcount and revenue (0.85). As we stretch out the correlation matrix with more variables (like headcount level) and turn those variables into ratios (like TPE and RPE) and then further into derivations of ratios over time (like T-VOL and other standard deviation measures) the correlation weakens, and therefore, the power of our T-VOL analytic as an influencer of the level of RPE seems to weaken too. But, all that said, there are reasons why such a correlation (currently 0.28) may never get very much higher – even with a larger sample size. It is an explanation that takes us full circle back to Fred and why the player is the special sauce.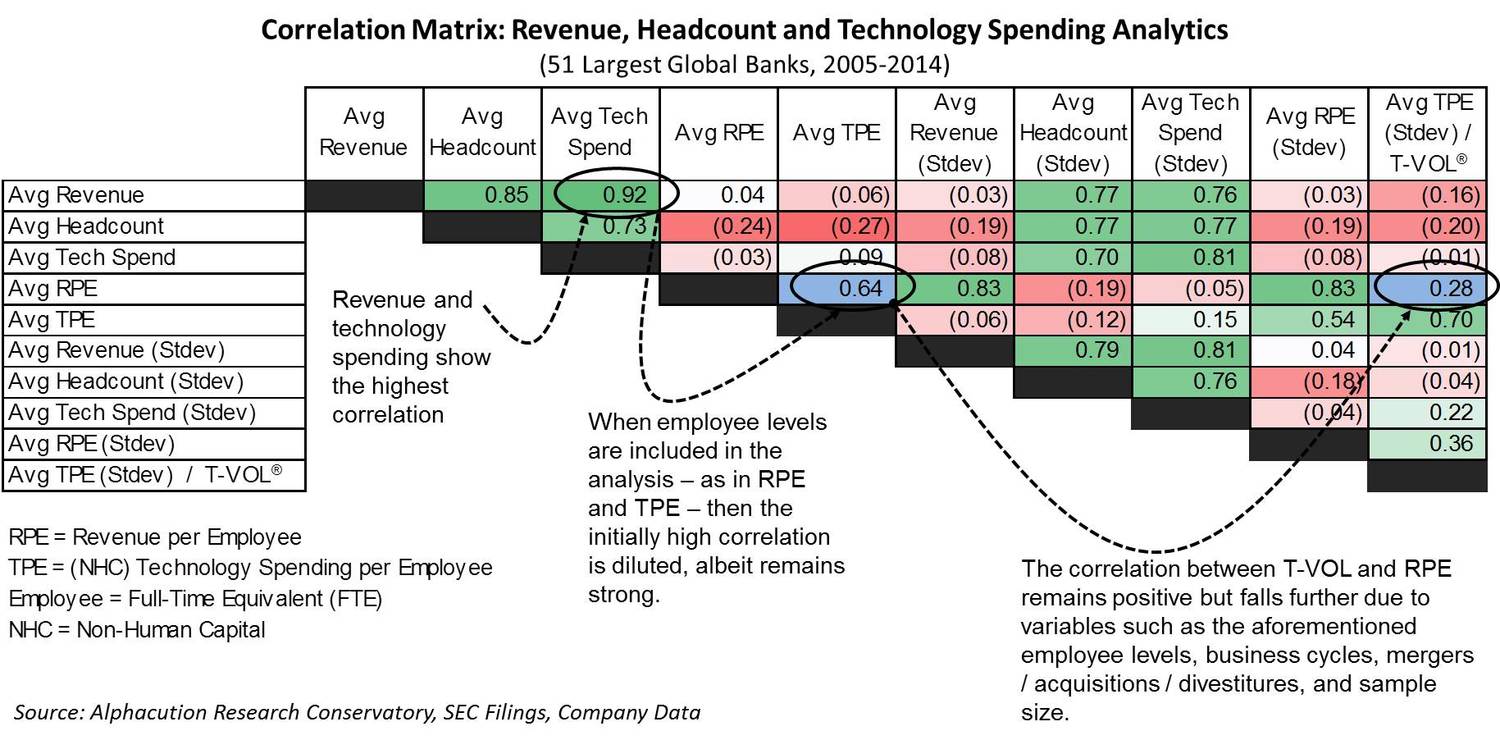
Technology spending – and derivative metrics like TPE and T-VOL and other members of our T-Greeks™ analytics suite (to be unveiled soon) – is never going to illustrate a direct and unimpeachable link to revenue all by itself, unless you are a highly specialized entity like a high frequency trading firm (and even then, personnel – the “players” – are going to make a critical impact). While comparisons of RPE and TPE / T-VOL demonstrate strong indications of operational effectiveness, large and highly diversified organizations, like global banks, have too many other variables that come into play.
Foremost among these is the agility to weather business cycles. In our current sample of the 10 years from 2005 to 2014 that bookend the global financial crisis (GFC), the financial volatility that was due primarily to credit and trading losses during 2008 and 2009 (and the stimulus initiatives that made landfall in 2010) distort the relationship between revenue and technology spending metrics. This agility – or lack thereof – has a major technical component.
The other key variable to bear in mind is the headcount level. We know from the prior matrix that headcount is mildly negatively correlated with RPE and TPE. Makes sense, since headcount level and RPE / TPE move in opposite directions, all else equal. But, more important than the number of employees is the composition of employees married with the composition of technologies. Balancing the right skills in the right positions with the optimal level of workflow automation and other operational efficiencies is going to be the most powerful algorithm for maximizing RPE (given the business mix and extreme cycles notwithstanding). The best hardware, the best software and the best data is still not going to amount to much with the best players. The leaders in the FSI ecosystem are most likely to have than a few “Fred Johnson’s” on their team.