
“They make it so easy.” – Richard Dobatse, Robinhood user (via New York Times)
“A fool and his money are soon parted.” – Thomas Tusser, poet
Imagine if you knew, ahead of time, exactly what bait to use?
Not only which bait to attract and influence the behavior of specific customers, but how to package the output of those behaviors – into an additional form of bait – in such a way as to leverage US listed market structure and maximize the probability of financial windfall. If so, chances are, you would share some of the vision that the founders of retail trading app and rising zeitgeist symbol, Robinhood, did circa 2013…
Now, the fact that Alphacution has been beating this drum for four weeks in a row (starting here, here and then here) is unintentional and unrehearsed. Certainly, we much prefer that our riffs come with a level of variety – and we will return to that variety shortly. However, as we have been grinding the numbers around order routing revenue, the new Rule 606 reporting format, provocative players (like, Robinhood) and secretive players (like, Citadel Securities, G1X/SIG or Two Sigma Securities, among others), we continue to learn more about how this puzzle fits together…
Our latest findings – and the thing that makes this next seemingly redundant drum beat necessary – relate to the economic value of trailing stop loss orders…
Most amateur traders are taught to use stop loss orders to do precisely what they say they are supposed to do: limit losses. For traders that aren’t able to watch their risks all day long, stop loss orders represent one tool by which part-time traders – like those who have other day jobs – can put their trades on autopilot. Moreover, in a zero-commission environment, there is no explicit cost to the trader if a trade gets stopped out. That trader can always get back into the trade, at no explicit cost.
Now, from an order flow perspective, it turns out that stop loss orders – and other variants, like trailing stop loss orders – are quite valuable. This category of orders is otherwise known as non-marketable limit orders (NMLO’s), and they are the type of order that high-speed market makers covet more than any other, as we will illustrate below:
Based on Alphacution’s current assembly of ~$490 million in order routing revenue for Q1 2020, NMLO’s represent 45.4% of the total – or, $222.9 million – and, the sum of marketable and non-marketable limit orders represent 67.7% of the total – or, $332.3 million: 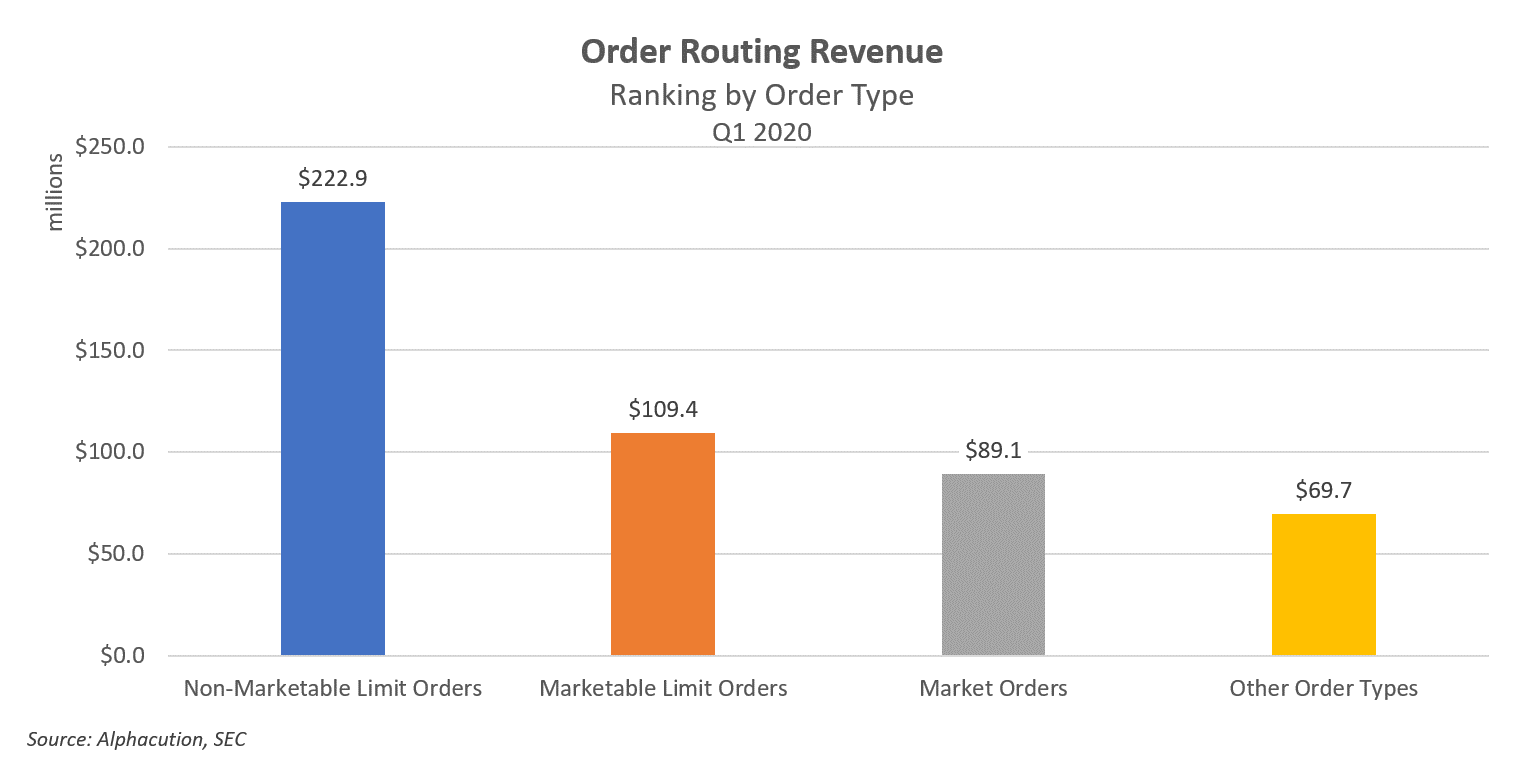
That’s all fine and good, but here’s where the plot thickens:
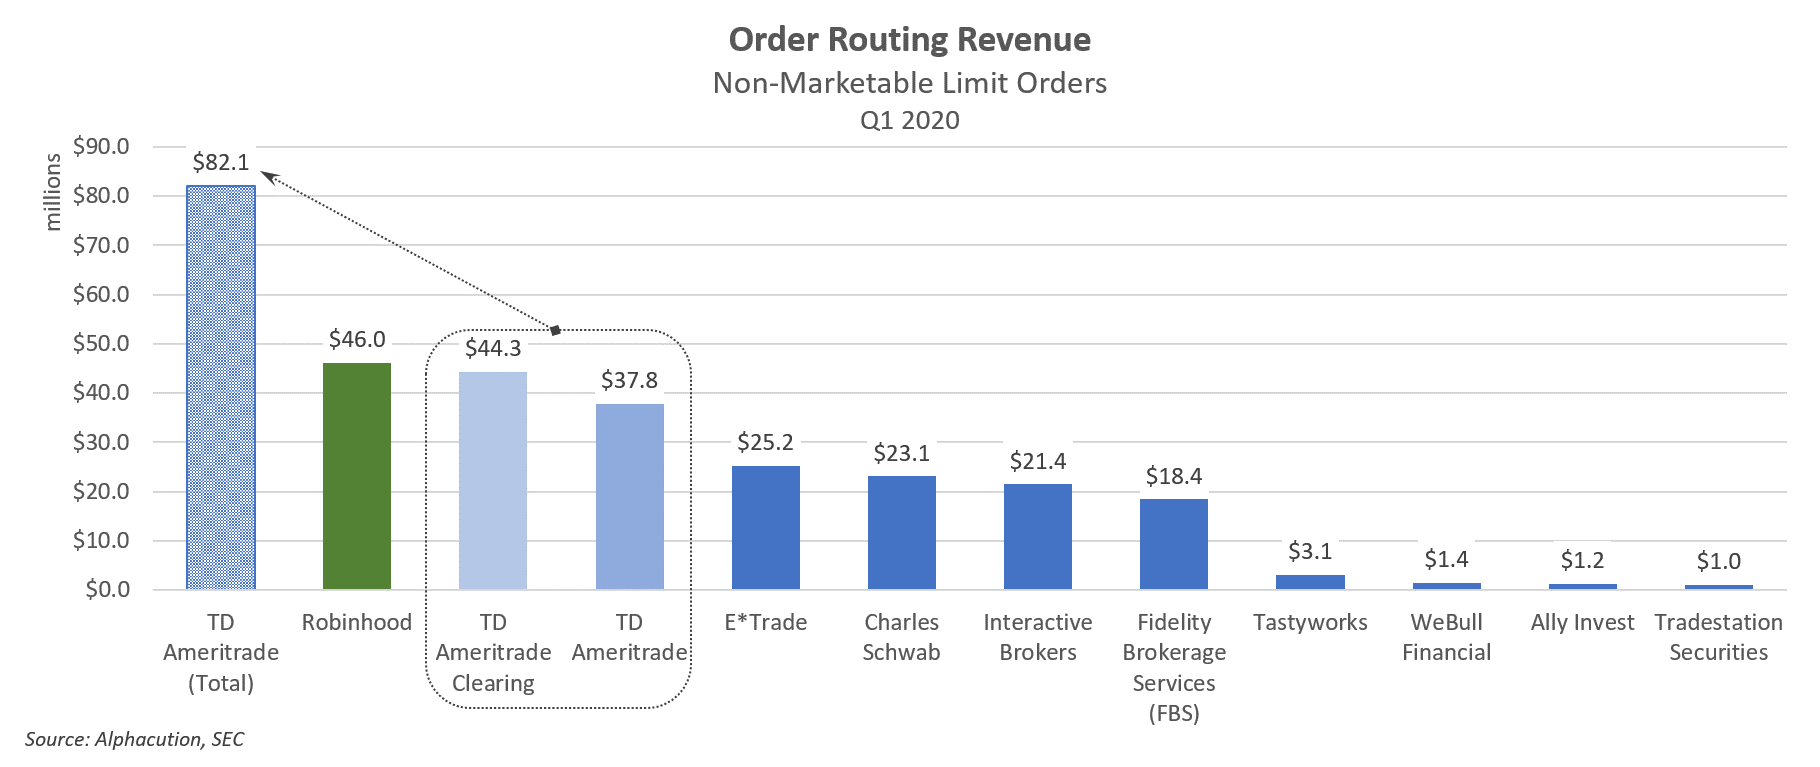
When we break down the contributors to NMLO routing revenue, you’ll never guess who’s punching way above its weight class. Depending on how we account for TD Ameritrade – as two entities (including TD Ameritrade Clearing) filing two separate 606 reports, or as one large retail brokerage platform – Robinhood sits in the #1 or #2 slot, representing $46.0 million (or, 20.7%) in total NMLO routing revenue for Q1 2020 – and clearly larger on this analytic than E*Trade, Schwab, Interactive Brokers (IBKR) and Fidelity (which does not engage in PFOF in stocks, but does so in options):
But wait, it gets even better:
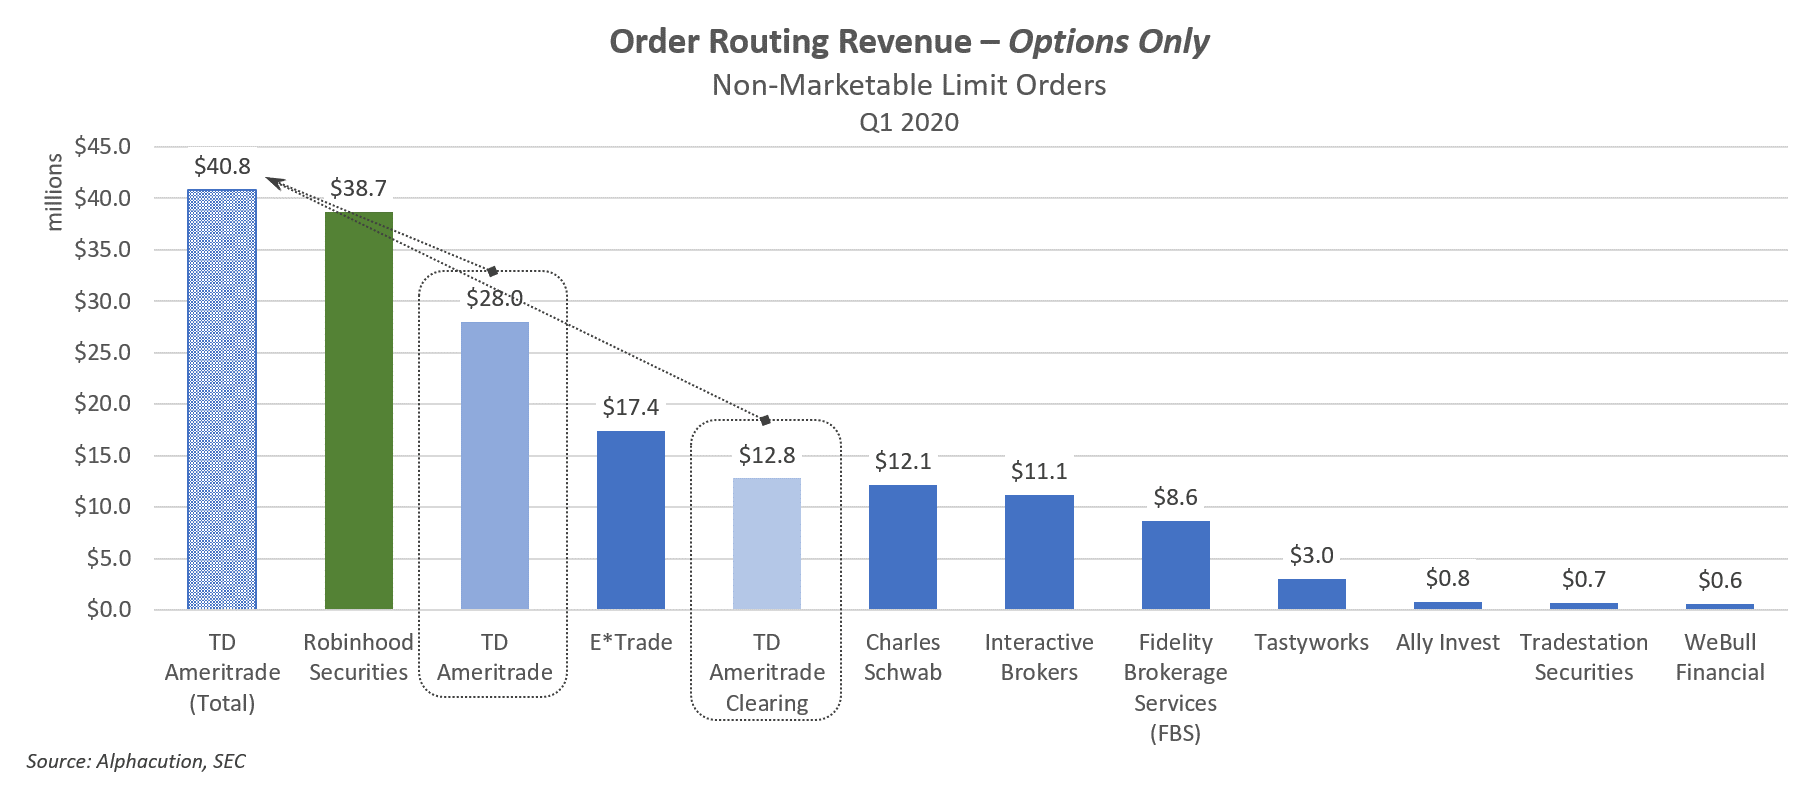
There are 4 categories of order types and 3 categories of products in the new 606 reports, which means that there are (potentially) 12 order type-product revenue pairs for each retailer of order flow. And, of the 12 order type-product pairs for Robinhood, non-marketable limit orders in options represent the largest category of order flow revenue. Not only that, at #2 amongst its peers, this category for Robinhood is within $2 million of being equivalent to the same option NMLO category for the combined version of (the much larger by client assets) TD Ameritrade as of Q1 2020. In other words, Robinhood is close to being the #1 largest player in the ecosystem by this measure:
With this in mind, let’s return to the idea that the Robinhood figures above have been targeted in advance, by design:
A frictionless and highly gamified environment that is made easy for its users to be stopped out as often as possible (in OPTIONS!) turns out to be a coveted counterparty to those who seek to compete for fleeting slivers of alpha in closest proximity to the sources of listed liquidity. In Alphacution’s vernacular, this is known as the structural alpha zone. By Silly Valley vernacular, this is known – by last count – as $8.6 billion…
In the chart, below, Alphacution presents a detailed summary of Robinhood’s order revenue breakdowns by product category, order type, and broker-dealer: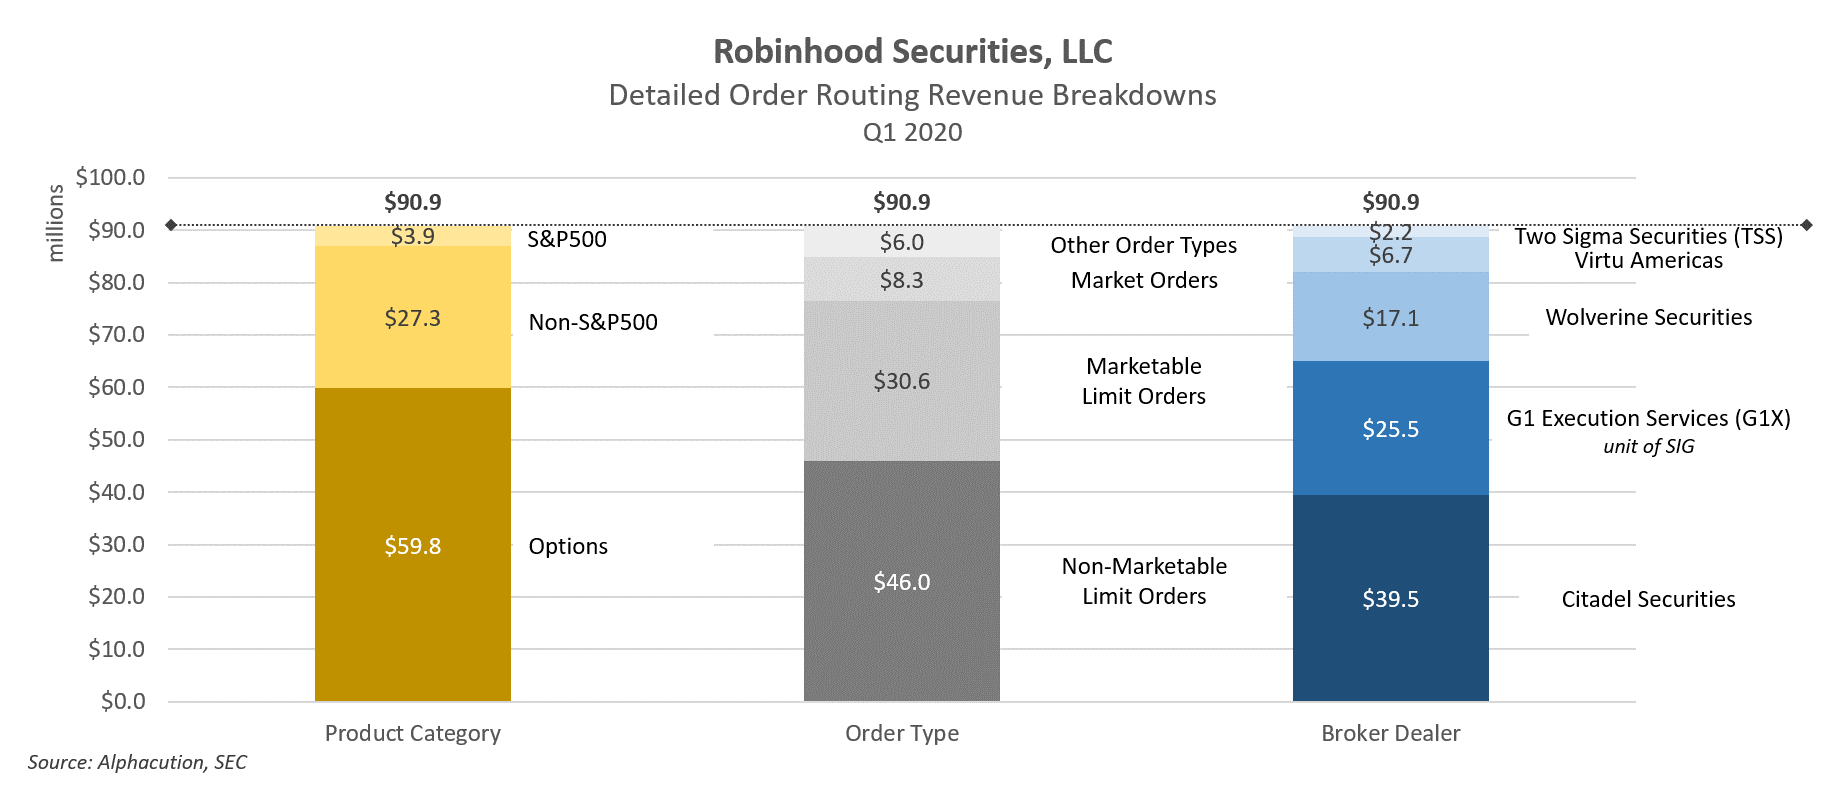
Hopefully, we can take a break from this topic for a while, but no guarantees. I would not be surprised to see Robinhood’s IPO announcement arrive in the months to come while valuation insanity and historically-aggressive interventionism persist…
Until next time…