If you believe the latest bromides, “IT strategy is business strategy”, then the success of any business is predicated on the deployment of technology – which includes the perpetual coordination of hardware, software, data and IT-related personnel (or human capital). Alphacution has applied this hypothesis to the financial services industry (FSI), first by modeling the technology-related spending of 51 of the largest global banks – arguably among the biggest buyers of technology in the FSI ecosystem – and then generating a series of benchmarks, analytics (many of which fall under the label, “T-Greeks”), visuals and narratives to describe how each market actor is performing in that ecosystem. Off the back of this first version of the Alphacution Composite Model, regional and global industry patterns also emerge, in addition to entity-specific metrics.
Focus on Revenue per Employee
One of the most fascinating pictures we have been able to generate in these early stages of the modeling is a normalized ranking of the sample banks by revenue per employee (RPE), where “employee” is typically reported as full-time equivalents (FTEs). It turns out that illustrating the relationship between these entities with inverted-value axes (where the biggest players by revenue and/or headcount are in the lower left corner and the smallest players are in the upper right corner) is the best way that we have found to display the entire sample in a single, digestible chart – as well as generate an “RPE benchmark.” We have recently added a couple “digital era” players – Google and Virtu Financial – to the mix in order to introduce the concept of digital change versus the more pedestrian evolutionary change (which will explore in much more detail in an upcoming post) (see Exhibit below). By the way, as a point of reference, the weighted average RPE for the banks in this exhibit over the 10-year period from 2005 to 2014 is US$275,000 per FTE. Also, as another point of reference, Google is generating 4x the RPE of the red sphere just below it. Translation: Google is generating the same level of revenue as the bank just below it on the following Exhibit (Bankred) with only 25% of the FTEs!
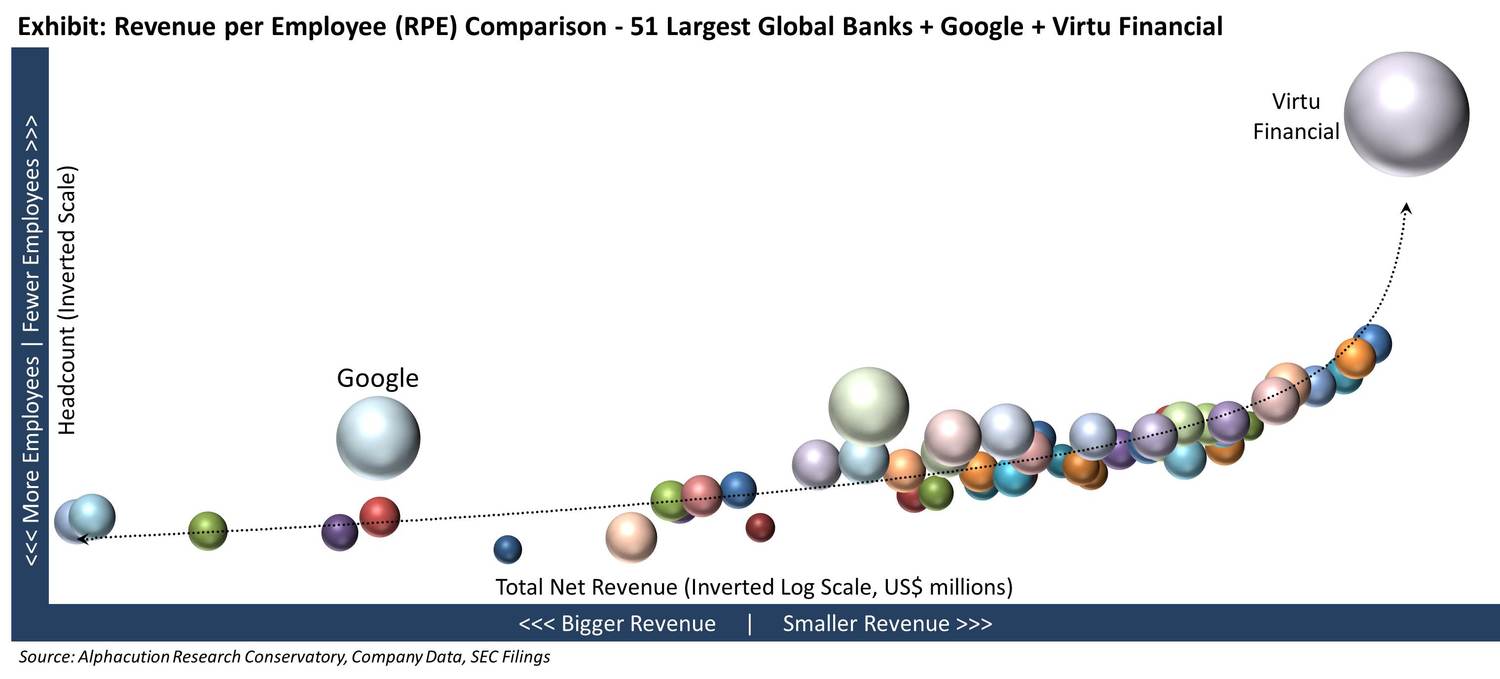
Furthermore, with this type of illustration, we can see which firms are above or below the benchmark given their scale – hence, the title of this introductory commentary: Can you defy your scale? At minimum, we can see which players generate the most revenue per FTE on both a relative and absolute basis. For instance, notable high-frequency trading (HFT) firms have very low headcount and generate exceedingly high RPE relative to all other members of the sample. We expect that this will remain true of the entire ecosystem once further modeling is complete.
We believe this illustration galvanizes several fundamental goals of the players in the ecosystem, such as: How productive can your enterprise be? Or, a more nuanced version of this: What is your enterprise return on technology (RoT)? These are fascinating questions – that go far beyond the FSI ecosystem – and which also generate some critical debates, particularly in a pivotal era such as now. For instance, roughly speaking, we know that IT-related human capital (not yet factored in the current version of the modeling) represents 2-3x that of the “non-human capital” (NHC) technology costs. So with Alphacution’s current estimate of NHC technology spending for 2014 for the global banking sector being over US$200 billion, we can expect that total cost of ownership (TCO) for banks is well north of half a trillion US dollars. Separate from the magnitude of the top-line numbers, the message here is that players need to continually optimize headcount (which can be slow and politically-challenging) while balancing technology spending (which in the digital era is exceedingly complex given the increasing pace of innovation). The leaders of any ecosystem will prove this to be possible by defying their scale, thus making them a “fulcrum” for how to calibrate that balance between human capital and technology to maximize RoT and RPE.
Technology Spending and Operational Diagnostics
Though the technology spending figures offer potent intelligence on many levels, there are additional benefits which are equally as impactful. It turns out that the change in tech spending metrics over time is a very useful operational analytic both as an internal enterprise strategy diagnostic for solution buyers and an external sales strategy diagnostic for solution providers. It may not be too far of a leap to consider these analytics as part of an investment selection process as well.
If it is true that IT strategy is business strategy, then the “volatility” of technology spending (which Alphacution has trademarked T-VOL™ as part of its suite of T-Greeks™) can provide incremental intelligence about the health and effectiveness of the enterprise (see Exhibit below).
Our hypothesis here –a s measured by the standard deviation of technology spending per employee (TPE) over time – is that high TPE dispersion represents operational distractions possibly caused by weaker management teams and low cultural cohesion whereas low TPE dispersion is a symbol of strength. One of the next steps in this analysis will be to take a look at the correlation between T-VOL and RPE to determine how powerful a lever it actually is.
These are just a couple of the impactful tools coming out of this early modeling. We are just getting started. Alphacution’s mission is to continue this modeling – both top-down and bottom-up – until the total FSI ecosystem “puzzle” can be seen in high-definition, supporting the strategy development process for both solution buyers and solution providers along the way. You can monitor and become a part of that journey at www.alphacution.com.