Part I of this post can be found here
Here’s the central question: After one year, does Hewlett-Packard Enterprise deliver tech savings for Deutsche Bank? (And, is this a harbinger or a template for other large banks and market participants?)
With the Annual Report and other financial disclosures released on March 11, 2016, Deutsche Bank (DB) has completed its 2015 reporting. Our original curiosity here was to determine if a technology outsourcing alliance between Hewlett Packard Enterprise (HPE) and DB – which was announced about a year ago in late February 2015 – has resulted in any observable impact on the technology spending patterns at DB.
With a fully updated model in hand, the results provide some strong signals – and some additional curiosities. 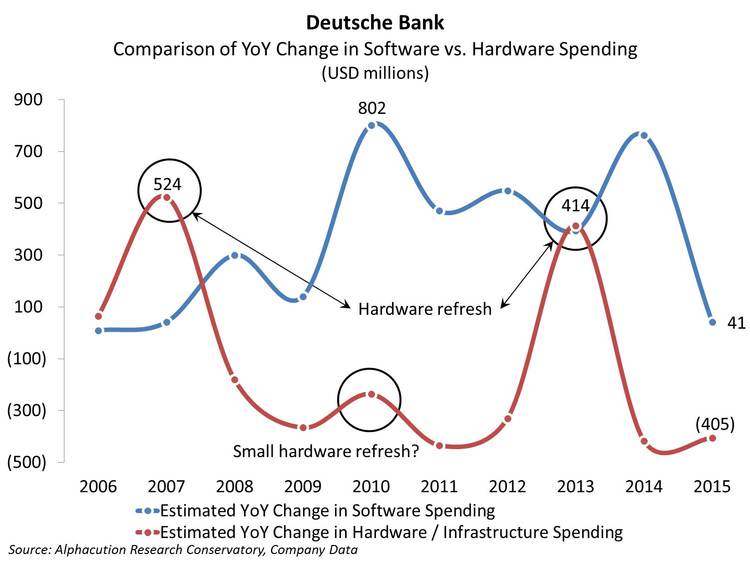 Here’s what we find: First, estimated year-over-year spending on hardware and infrastructure – a component of TCO where HPE is expected to have the most impact – is down $405 million 2015 vs. 2014, which represents an 8% improvement during the period – and is about the same amount for the 2nd year in a row (see exhibit left).
Of course, there is no confirmation available to correlate this decrease in infrastructure spending with the DB-HPE alliance. Neither DB nor HPE have confirmed the correlation of these results that we are aware of – we are assuming that this correlation exists.
Furthermore, though it may be a coincidence, US$405 million is about the same amount that the overall technology spending (including an estimated human capital allocation) was down from 2014 to 2015 (see exhibit on right).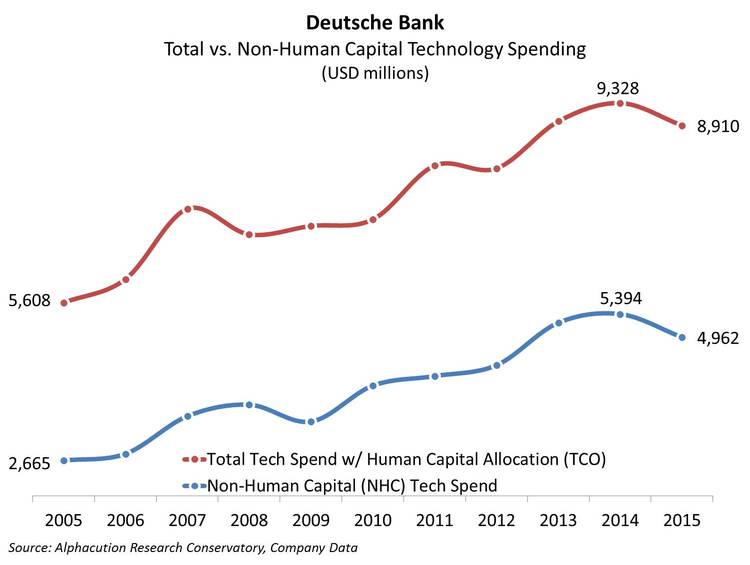
What we find fascinating about these figures is the lack of additional human capital savings. In other words, we normally would have expected an alliance such as this to yield a reduction in headcount (from the personnel that formerly managed this technical infrastructure on a proprietary basis). Following from this, the total tech spend (the red line on right) should have declined by an amount greater than the NHC tech spend (blue line on right). Often, human capital is the largest component of TCO (total cost of ownership) – and, sometimes, a multiple of the cost of all the other factors (hardware, software and data) combined. For this reason, the catalyst for such an outsourcing arrangement might normally be related to a desire for headcount reductions much more than for reductions in the cost of hardware.
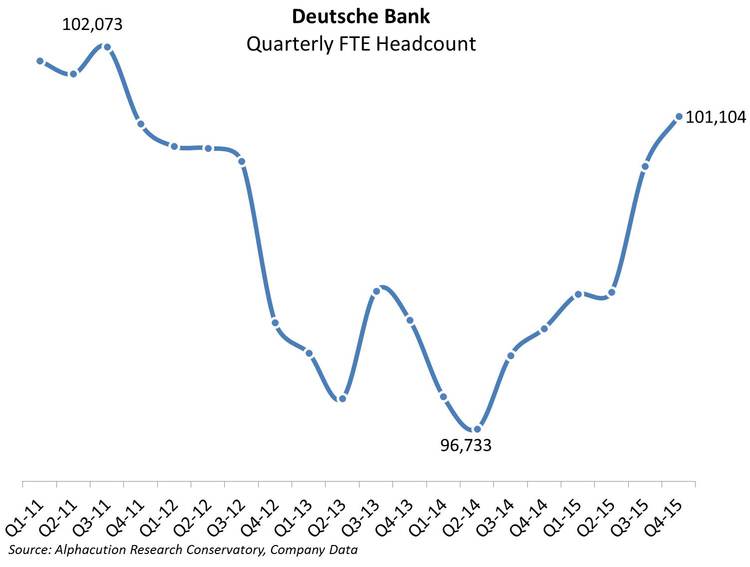 In this case, there is nothing in the modeling that suggests that there has been a reduction in headcount – technology personnel or others; in fact, to the contrary. This conclusion is supported in the data. In the first of two charts (left), DB total (full-time equivalent – FTE) headcount is up year-over-year and within 1,000 FTEs of a 5-year high. This is particularly fascinating since global banking headcount, in general, face notable headwinds. In specific, in the second of two charts (below), we illustrate where the concentration of the headcount increase resides: totally within the infrastructure bucket. In 2015, all segments at DB showed flat to declining headcount except for one – infrastructure; a trend that has been intact since the end of 2009 as infrastructure headcount has grown from 33% of total headcount at the end of 2010 to 44% at the end of 2015.
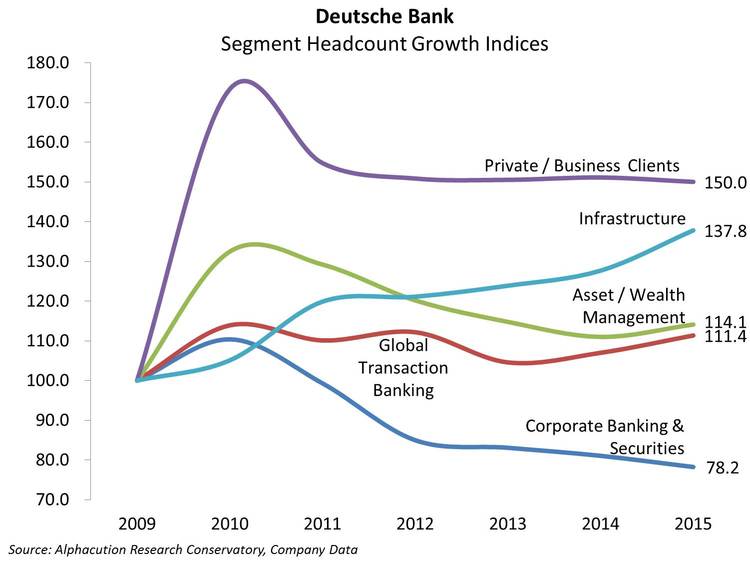
Now, we caution attributing consistent net increases in infrastructure personnel solely to tech-related personnel. More likely, we would point to increases in governance, risk and compliance-related (GRC) personnel who are also included in this overall infrastructure segment. 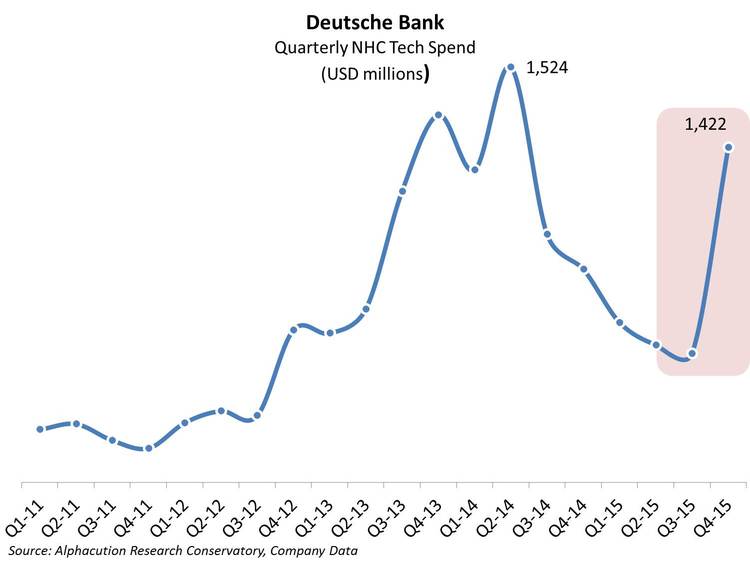 Still, we would conclude that either reconfiguration of DB’s technical footprint has yet to bear fruit in the form of lower technology headcount or that the increase in needs for GRC personnel is more dramatic than we currently perceive.
Lastly, on the basis of the figures presented so far, one would confidently conclude that the HPE-DB deal has in fact borne some fruit. However, where things become strange are in the most recent quarterly figures (see chart below).
What happened in the 4th quarter of 2015, the biggest spike in NHC tech spend in about 20 quarters?! Still representing a yoy decline in tech spending (with NHC tech spend down 8% yoy – as outlined above), Q4-15 put a huge dent in the progress of the prior three quarters. But why? I can think of a few reasons…


