“What you do speaks so loudly that I cannot hear what you say.” – Ralph Waldo Emerson
On Thursday, February 20, Morgan Stanley (MS) announced its acquisition of E*Trade (ETFC) for $13 billion in a brillaint move that simultaneously 1) responds to the recent move to $zero commissions in retail brokerage; 2) responds to Charles Schwab’s recent announcement to acquire primary ETFC competitor TD Ameritrade; 3) boosts MS’s position in coveted wealth management channels; 4a) takes greater control of coveted retail order flows – and thus, (4b) away from competitive market making firms, like Citadel Securities and Virtu; 5) takes the last of the major independent discount retailed brokerage platforms off the proverbial table – sorry, Goldman; and 6) arguably completes a dramatic arc of industry evolution and consolidation that began with Schwab’s acquisition of CyBerCorp in early 2000 and Citi’s acquisition of Lava Trading in 2004…
As trick shots go, this one is a doozy!
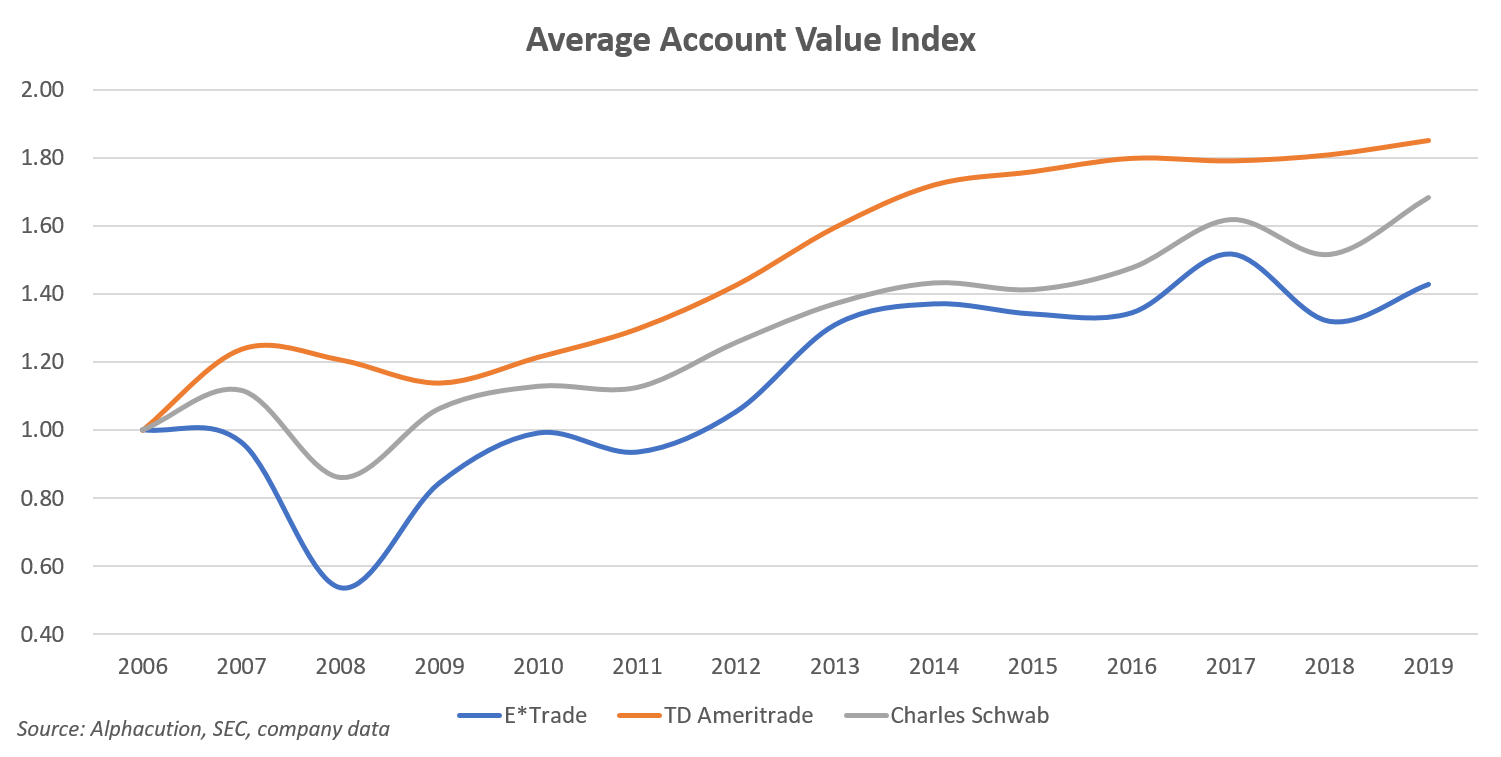
Given that, I wanted to extend some thoughts around recent modeling that we started with the recent Feed post, “Ch-ch-changes: A Subscription to “Charles Ameritrade“: It turns out, the key players in this market drama have distinct profiles. One analytic we have been fiddling with is average account value, which is roughly the ratio of clients assets to active brokerage accounts.
When we compare the average account values for Schwab (SCHW), TD Ameritrade (AMTD) – and now, ETFC – over the maximum overlapping period of 14 years beginning 2006 and ending 2019 in the chart below, a fascinating insight comes to light: Schwab’s clientele represents a notably different demographic (and activity level) than both AMTD and EFTC.
Since, the reported information does not provide actual demographic data, our assumption is that Schwab’s larger average account value can be attributed to an older group of investors, with AMTD and ETFC therefore attributable to a younger clientele based on smaller average account values. Furthermore, some of you may notice that the “wiggly lines” represented by SCHW and ETFC are reminiscent of a broad market index, like the S&P 500. To us, this would indicate a bias towards a buy-and-hold strategy among these investors as compared to the “smoother” AMTD line, which could be interpreted as the trajectory of a more active, absolute-return strategy. (Though we are not going to get into those weeds here, AMTD’s significantly greater order routing revenue relative to ETFC and SCHW – figures that Alphacution will be updating for 2019 imminently – is supportive of these demographic and strategy biases.)
As for Morgan Stanley, in a world where $zero commissions need to be made up elsewhere – and the evolving revenue models already favor net interest income and advisory fees over commissions and other transactional income – this deal is far less about trading than it is about growing and managing balance sheet (even though the extra flows, if integrated properly, are quite valuable, too).
Until next time…
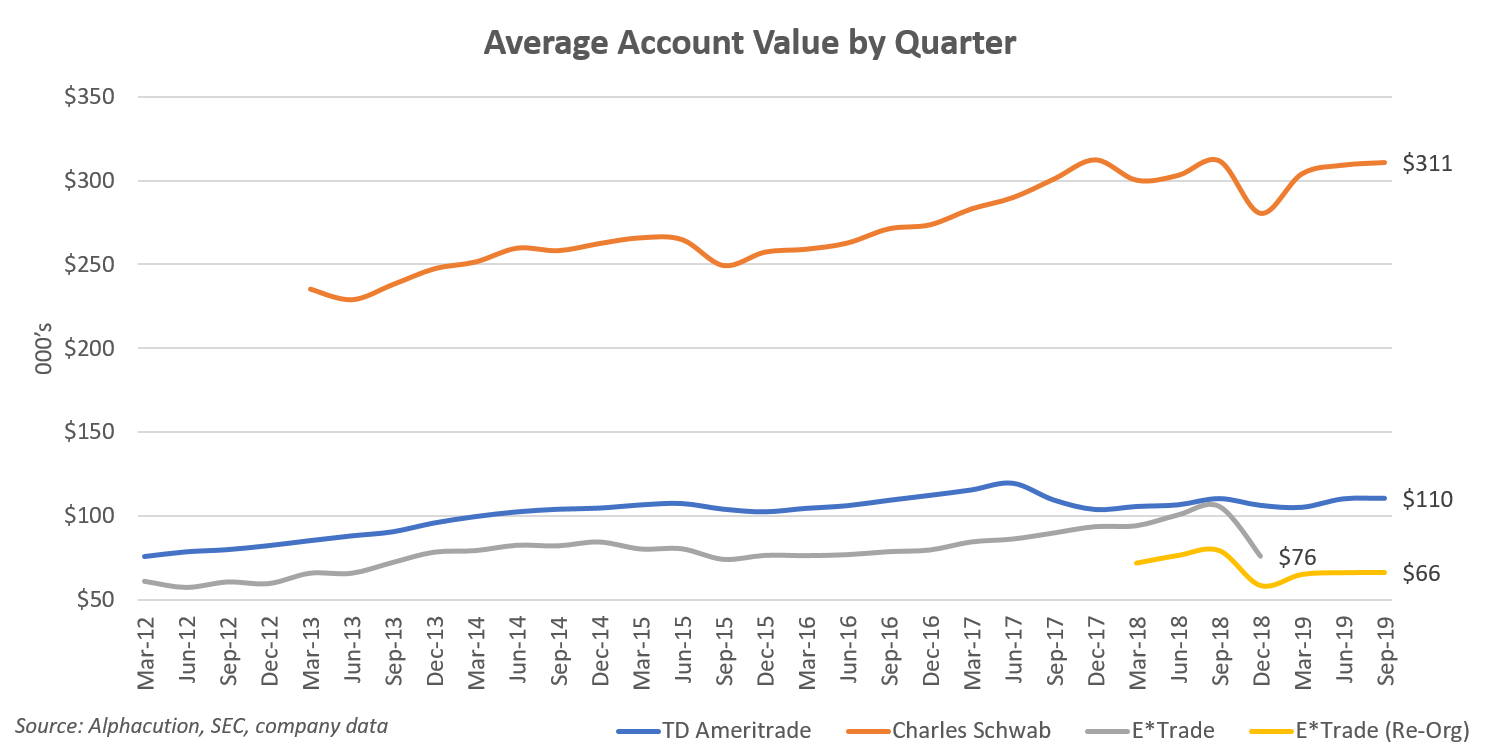
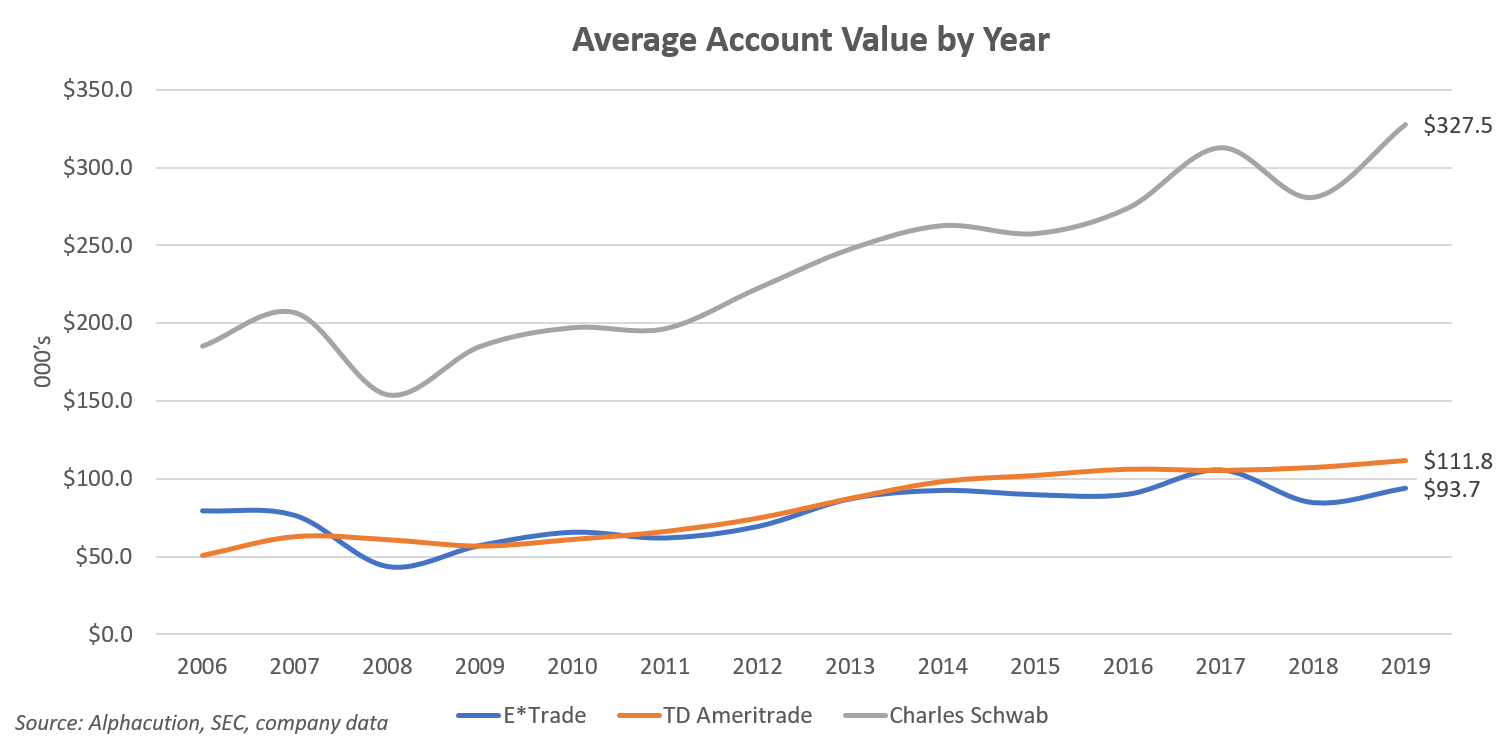
P.S. – The charts below are intended to provide additional color to the analysis. No doubt, given the importance of these themes to the overall narrative of market macrostructure, we will be back soon to dig further into these pictures.