
Though you may have fully gorged yourself on tales of latency over the past few years, I’m here to tell you that that overall story is far from over. Reason being, there is more than one form of latency – and the value (or cost – depending on your perspective) of at least one of the other types of latency will make the first narrative – the super-sexy knocking-on-the-door-of-the-speed-of-light version – seem like the Leda moon orbiting Jupiter. This is where human latency enters the vernacular.
From where I sit – and though the nuances can be hotly debated beyond this short essay – there are actually three primary forms of latency – and a couple hybrid versions of those. These primary forms include “network / proximity latency”, “compute latency”, and “collaboration latency”. (Of course, the technology arms race of the past decade dealt almost exclusively with minimizing network / proximity latency.) Each of these general forms is a mix of native technical and human latencies, as follows (see Exhibit 1):
With this rudimentary taxonomy in mind, let’s try to provide some support and a framework for the claim that the cost (and opportunity) of addressing human latency is significantly greater than the value of the network and proximity latencies that we have been exposed to so far – which is still measured in billions of dollars annually.
To begin to measure the value of human latency, we need a benchmark. It turns out that revenue per employee (RPE) is the basis for such a benchmark. Furthermore, when you calculate the RPE’s of several players in the ecosystem – in this case, our model contains such calculations for 51 of the largest banks in the world (from 15 countries) and a few others – you can actually see how such a benchmark takes shape, as follows (see Exhibit 2):
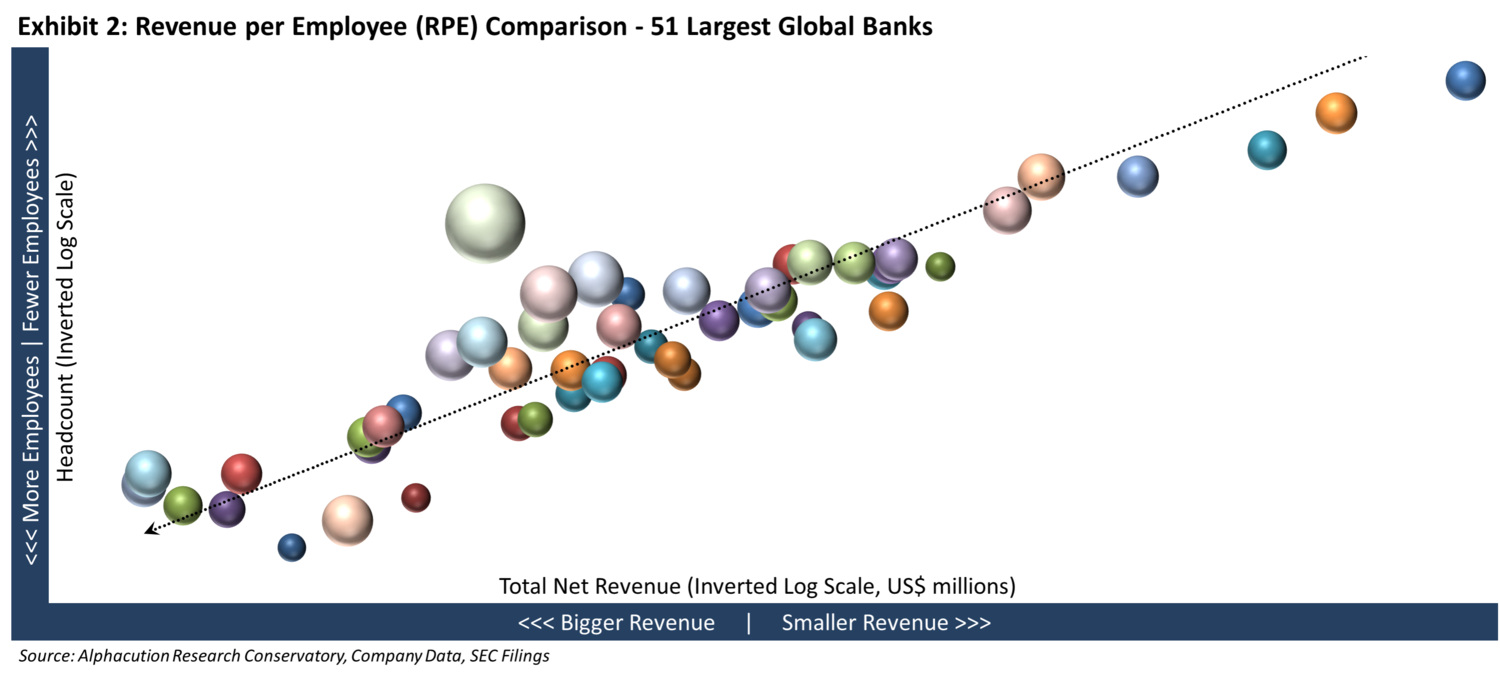
Now, this picture is both a little daunting and also extremely valuable for educating us about the financial services ecosystem – and the sub-sectors within it, like capital markets. For our purposes here, the key takeaway for estimating the value of human latency – which, in a way, is the other side of the “technical leverage” coin – is to maximize RPE given your scale.
Another – somewhat less proactive – way to think about this is to reduce headcount while maintaining total net revenue levels. This has been the strategy and/or the evidence of the global banking world since 2011 when aggregate banking industry headcount actually began to head south. Shedding an average of 90,000 full-time equivalents (FTEs) for each of the 3 years ending 2014, the global banking sector still managed to deliver peak 10-year total net revenue for 2014. (Additional data relative to this modeling can be found in the Open Access Exhibit Library at www.alphacution.com.)
Still with me? Here’s where the story gets even more fascinating: The RPE boundaries of our sample include a 10-year average of US$139,500 per employee at the minimum (a Chinese bank) and a 2013 figure of US$2.74 million per employee at the maximum (leading HFT firm, not shown). Lastly, the weighted average RPE of the 51 banks in our current sample (for the 10-year period 2005-2014) is US$275,000.
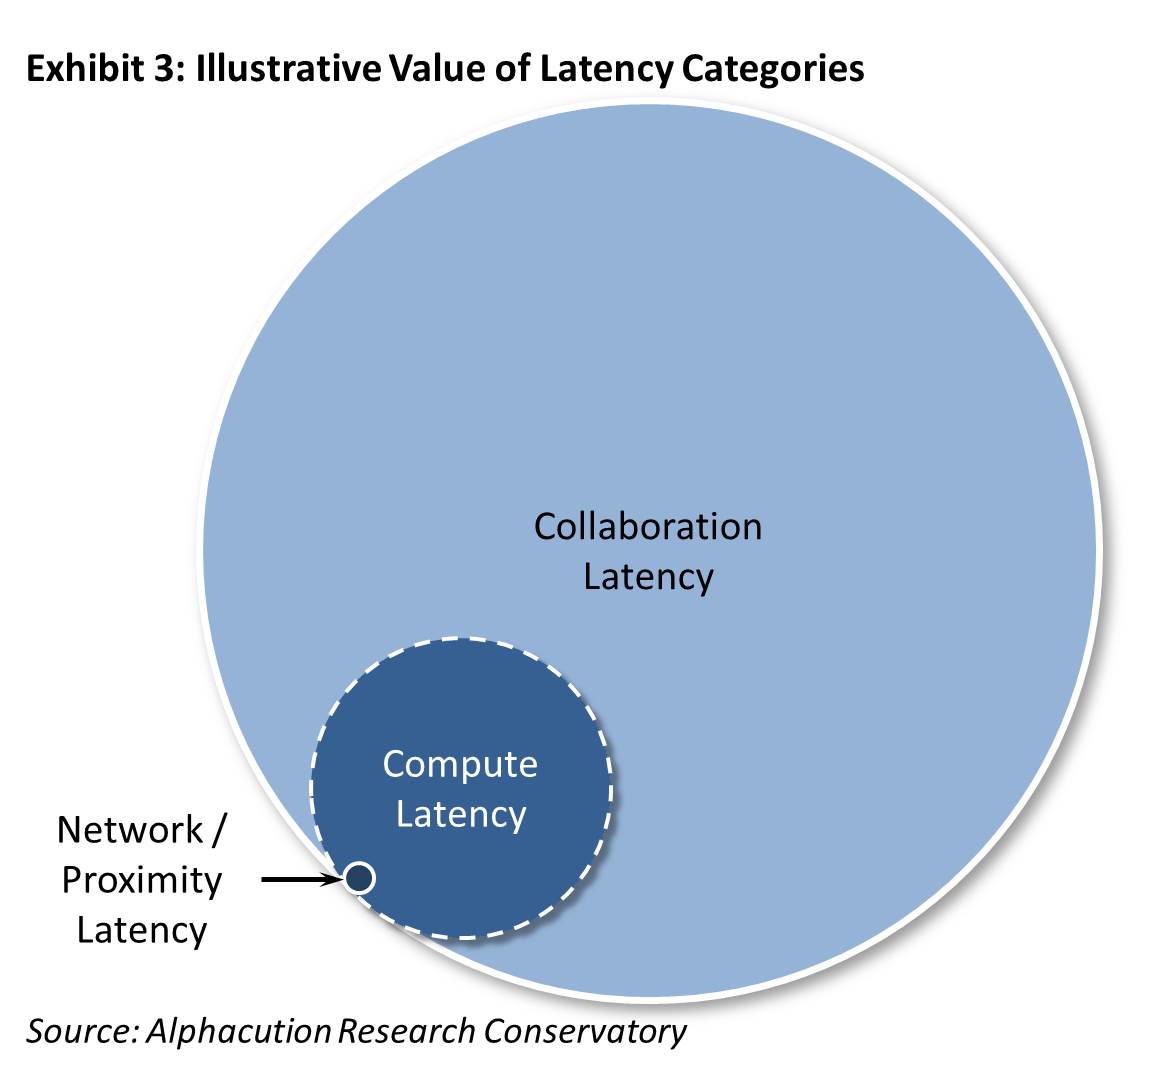 So, if we were to estimate that the global banking sector employed 10.8 million FTEs in 2014, then a 1% reduction in this headcount would be 107,643 FTEs. And, these FTE’s generating an average of US$275,000 in revenues per year is equivalent to US$29.6 billion in total value – that’s nearly $30 billion in value per each 1% of total global banking headcount in 2014. This technical leverage / human latency dynamic – though not reflective of a perfect correlation, of course – at least begins to paint a noteworthy picture, as follows (see Exhibit 3):
Though there are some very solid and defensible numbers behind this analysis, it is still basically back of the envelope. I am not proclaiming that the ratio of human latency value to technical latency value is 30:1. No. Nor, am I necessarily highlighting any of the specific numbers in the flow of the argument. More refined and supported estimates are warranted in time. But, for now, the real point here is that process re-engineering to enhance levels of automation and re-purpose skills to less-automatable functions in these workflows has everything in the world to do with digital transformation. And, with the apparent value in such automation being so large, it seems abundantly clear that the incentives are compelling to get on with it, as well.