Digital crumbs are everywhere. Like the fabled trail left behind for others to follow and discover, there are fascinating clues to be harvested from increasingly abundant data. Yes, the fast-streaming and big data versions of these digital crumbs offer untold clues and patterns – but only seen after applying the latest apparatus to the chore. There are also amazing clues to be discovered by picking up one crumb at a time (often by hand) – and then assembling that collection into a vivid prototypical picture.
One of the most potent forms of data innovation comes from such manual assembly of these “crumbs” followed by process refinement, technology deployment, iteration of these steps and ultimately increasing levels of automation. It’s not the glamorous end of the data innovation assembly line, but it is absolutely necessary to get there. (Thank the folks in your enterprise data management group if you like the flow of analytics to your desktop or mobile device.)
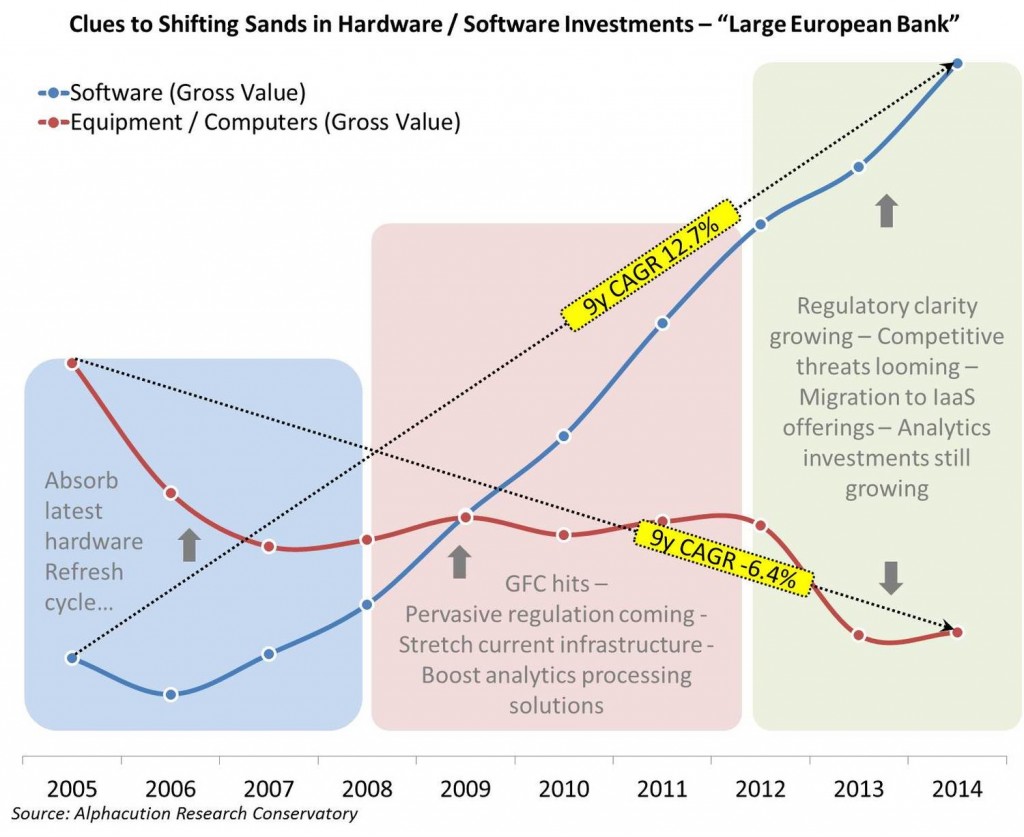
Anyway, here’s a potent case in point: Some of these so-called digital crumbs, harvested from literally hundreds of publicly-available documents, provide fascinating clues about the transformation of technology in financial services, particularly in the post-global financial crisis (GFC) era. In specific, we can see growing evidence of the shift from capital expenditures (“capex”) to operating expenses (“opex”) for hardware and other infrastructure as well as an inverse shift in opex to capex for software. Below, is one sample from a large European bank.
We often hear stories that this kind of phenomenon is happening – or should be happening – but typically not with much detail. In this example, hardware assets decline at 6.4% per annum (9-year CAGR) while software assets increase in value at 12.7% per annum (9-year CAGR) for the period 2005-2014. Translation: the value of hardware assets at this bank are roughly cut in half over the period, from US$4 billion to about US$2.2 billion. Meanwhile, over the same period, software assets skyrocket from a low of US$1.7 billion to US$5.8 billion, an aggregate 240% increase in 8 years.
For an additional layer of context, this bank has minimal retail and commercial presence, as indicated by roughly 11% of total net revenue and 19% of total headcount related to those business segments; the remainder being largely dedicated to investment banking and wealth management. These details support our assumption that investments in equipment are largely related to information technology hardware and networking equipment as opposed to significant allocations to retail banking equipment, like ATM’s, for example.
Furthermore, we assume that the decline in the value of equipment assets is due to a combination of both price declines on the refresh of contiguous equipment (likely toward the beginning of our modeling period) and shifts to new equipment leasing arrangement and new IaaS (infrastructure-as-a-service) offerings towards the end of our modeling period in 2014.
These facts are notable for several reasons. One reason that sticks out for me is the gap between the numbers and the prevailing narratives. The prevailing narrative describes a landscape – at least for the largest banks – that is budget constrained and still skeptical of the total value proposition of IaaS. Yet, the numbers show clues of major moves to reduce hardware costs while simultaneously investing massively in new software. (Note: More detail on software allocations in Part II to this post.) Now, my hypothesis is that such prevailing narratives are an illusion caused by information asymmetries in the market ecosystem. Call it misinformation, misdiagnosis, false positives or counter-intelligence, the punditry typically can’t reconcile this gap because of who they do or don’t talk to – as well as what the players themselves – both buyers and sellers- do and don’t confess.
I held on to this prevailing narrative until the numbers provided clues that the truth was likely explained elsewhere. Which leads to a closing general point: Few of us have – or have the patience to take – the time to perform this type data innovation any more in our increasingly speedy world, which is precisely why its value is as great as ever. Since, as the flow of an increasing roster of datasets becomes more automated, it is the assembly of this Galapagos-like diversity of those datasets that will prove so valuable along the road ahead. Today, omni-dimensional pattern recognition is the true art in data science – and this art is not necessarily confined to that which is already automated.
Don’t be afraid of the crumbs. There is far more than just the devil in those details.


