
Executive Summary
Riding the wave of the FinTech juggernaut, technology now permeates all aspects of the financial services ecosystem; front-to-back, top-to-bottom and across the entire business segment spectrum. Any lingering gaps between technology strategy and business strategy are closing; making them indistinguishable from one another.
And yet, for all the promise of the revolutions in artificial intelligence, cloud and big data, such attempts are met with unforgiving challenges. Most players in this ecosystem are still using dulled intelligence tools to navigate this rapidly changing and increasingly techno-centric landscape. Finding balance between the primary engines of productivity – information technology and human capital – continues to be conducted like a game of Marco Polo. Operational alpha – a kissing cousin of terms like digital transformation and process re-engineering – is a growing theme among the pantheon of new vernacular in this space that seeks to illuminate such challenges. However, despite its descriptive elegance, operational alpha remains an emerging and elusive concept.
In the midst of an evolving supply chain, solution providers end up paying lip service to total cost of ownership (TCO) benefits without a deeper empirical understanding of what those benefits actually are. They are somewhat blameless in this approach because it is all the firepower they have; where innovation around better intelligence tools have yet to raise the bar. Not to be outdone, solution buyers play a similar game of echolocation; navigating the search for balance between the two productivity engines with little more than a foggy sense of the operational composition and cost structure of their peers and competitors. Today, the use of finger-in-the-air estimation or SWAG’s (scientific wild-ass guess) for critical intelligence needs – like the economic impacts of technology investments – is ripe for improvement.
Alphacution has set out to influence this dynamic in a new direction, starting with one simple question: What do banks spend on technology? Possessing vision and desire to eventually move beyond banks, we started there because banks provide more access to financial and operational data than any other player profile in the financial services ecosystem via regulatory filings. They are also the biggest spenders on technology. As such, Alphacution’s initial work has already paid dividends, highlighted by the early development of our T-Greeks Benchmarking Framework and the introduction of the concept and measurement, Return on Technology. We knew from day one that the main challenge in answering this question for the asset management universe was always going to be that they are mostly private – if not, highly secretive – and therefore, accessing the right data was going to be very difficult.
But, it turns out, there is an alternative path to the estimation of TCO – and it relies on answering a different question: How do asset managers scale? With this question, we are essentially asking about the change in human capital allocation as assets under management (AUM) grows – which allows us to leverage data items that should be easier to find: AUM and headcount.
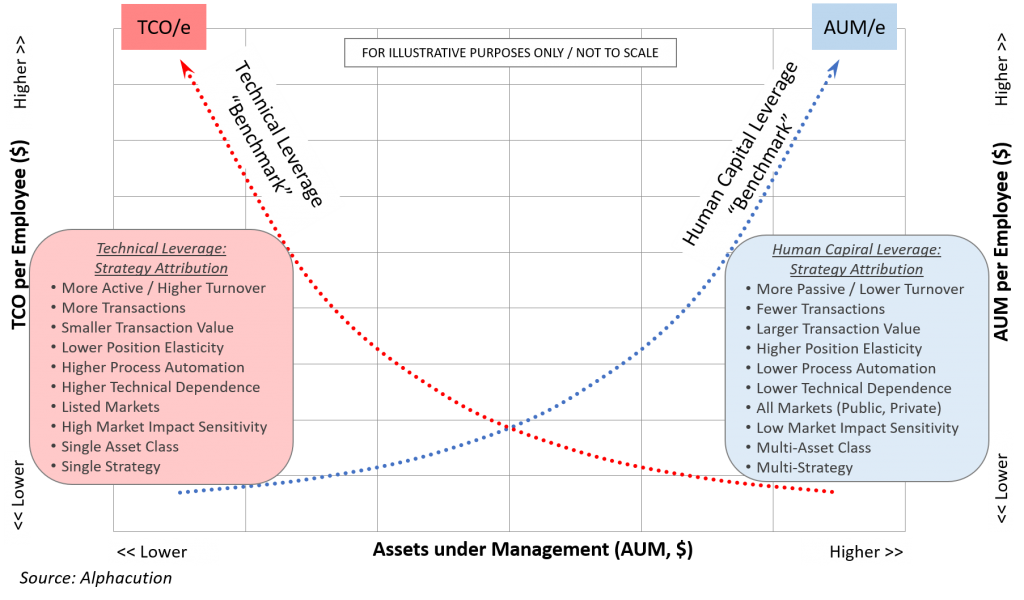
Moreover, this approach would be useful across the entire continuum of managers and strategies; even in cases where the most highly-automated methods are being deployed. All strategies need people, but all strategies don’t need the same allocation of people for each new dollar of AUM. Asset scaling is strategy dependent; human capital scaling is process dependent. Therefore – as our hypothesis goes – the nature of strategy workflow will be related to the ratio of AUM and headcount. That ratio – “AUM/e” – should be indicative of the level of automation in the underlying strategy. We call this phenomenon human capital leverage.
Similarly, we should be able to measure the change in technology capital allocations as AUM grows with the ratio of TCO per employee (TCO/e). In this case, TCO/e should be indicative of the technology capital intensity of a strategy’s workflow – or, technical leverage.
Lastly, because information technology and human capital are the engines of production for service businesses, quantifying one of them defines the other, by default. They are two pieces of a whole, and their proportions should move inversely to one another as AUM grows. When AUM/e goes up, TCO/e should go down – and vice versa. And, since accurately quantifying TCO/e for private companies is very difficult without proper context, we can use the more easily observable AUM/e ratio as a back door to deduce TCO/e, thus identifying the answer to our original question – and, in a way that is more credible than SWAG.
This chain of logic brings us home to the claim that the strategy attributes of AUM, technology spending, and employee headcount are all related in a persistent manner. With that, empirical evidence should allow us to define the change in both technical leverage and human capital leverage with changes in AUM in the form of “benchmarks” (see Exhibit 1).
Exhibit 1: Annotated Framework Hypothesis – Technical, Human Capital Leverage Benchmarks
In this 42-page, 34-exhibit study, Alphacution goes to new lengths to apply the axiom that effective management requires effective measurement – and begins the process of supporting its hypothesis that there are persistent – and ultimately predictable – relationships between trading and operational factors for asset managers. With most asset managers being private, support for this hypothesis also means that technology spending – a rarely observable data item in this universe – can be estimated with more readily observable and contextual data about AUM and employee headcount.
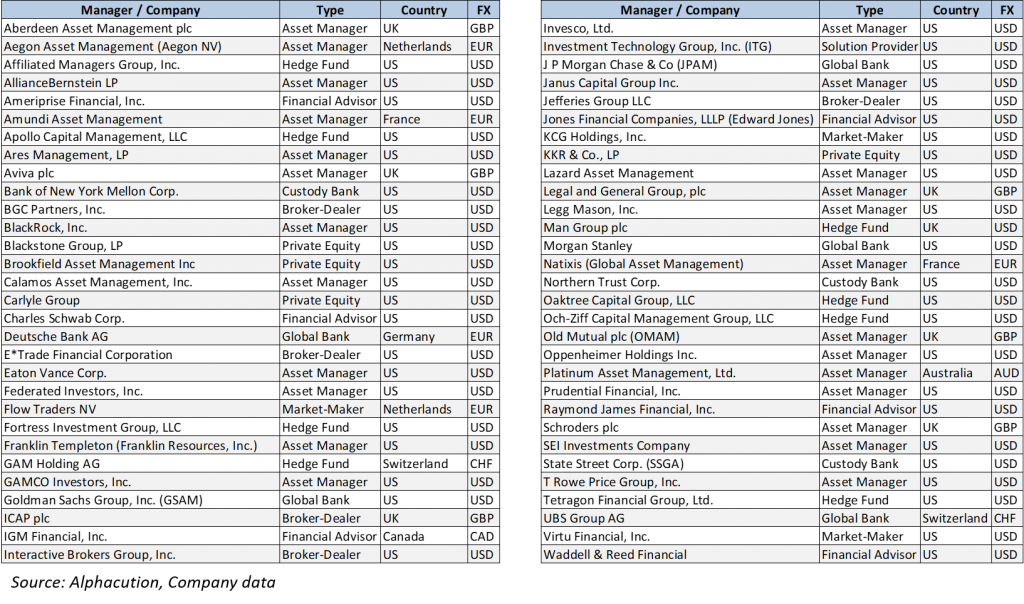
The good news is that Alphacution has identified 37 public asset managers, hedge funds and private equity firms – along with another 23 bulge-bracket banks with asset management divisions, financial advisors, and a series of proxies (that come to us in the form of broker dealers and market-making firms) – resulting in a total of 60 core models – to test this hypothesis (see Exhibit 2).
Exhibit 2: List of Asset Managers, Key Attributes in the Core Modeling Sample
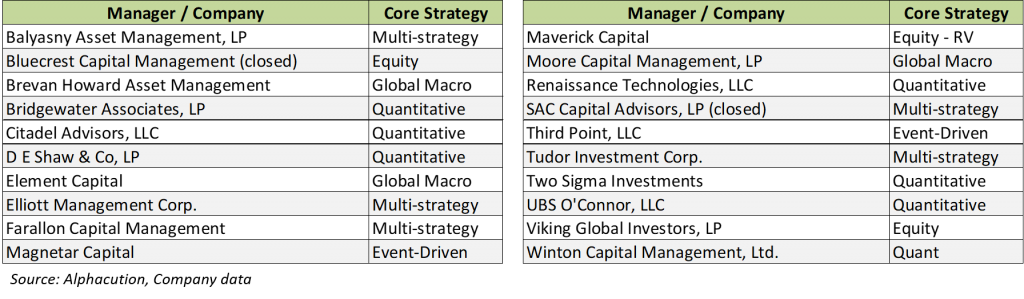
Supplemental data for these 60 core models comes from a collection of 98 additional asset managers harvested from the US Securities and Exchange Commission’s (SEC) Form ADV; a representative sample for which can be found in Exhibit 3.
Exhibit 3: Representative List of Asset Managers, Core Strategy in the Supplemental Data Sample
The resulting dataset for this study – represented by a grand total of 158 companies – is based on the modeling of three primary factors: technology spending (TCO), assets under management (AUM), and headcount (e) collected for up to twelve years beginning 2005 and ending 2016, wherever applicable. The resulting story, however, is based on the interplay between two novel analytics: TCO/e and AUM/e.
In the end, Alphacution believes that validating this hypothesis is a dramatic first step towards extending its techno-operational benchmarking framework to key stakeholders in the global asset management universe; one that delivers practical applications that they currently need and do not have. How strong the contextual power is from this initial sample of empirical evidence – and the potential to deliver navigational intelligence to asset managers, hedge funds and their vendor partners – is what Alphacution begins to expose here.
Rest assured. The days of wild-assed guessing on this topic are coming to an end. Sales enablement efforts and demands for better competitive intelligence tools need not remain in the fog. For students of the game – and we expect there to be many of you – the journey to understanding the possibilities brought by this version of Alphacution’s framework is a fascinating one, and the view out of the windshield from there is better yet.
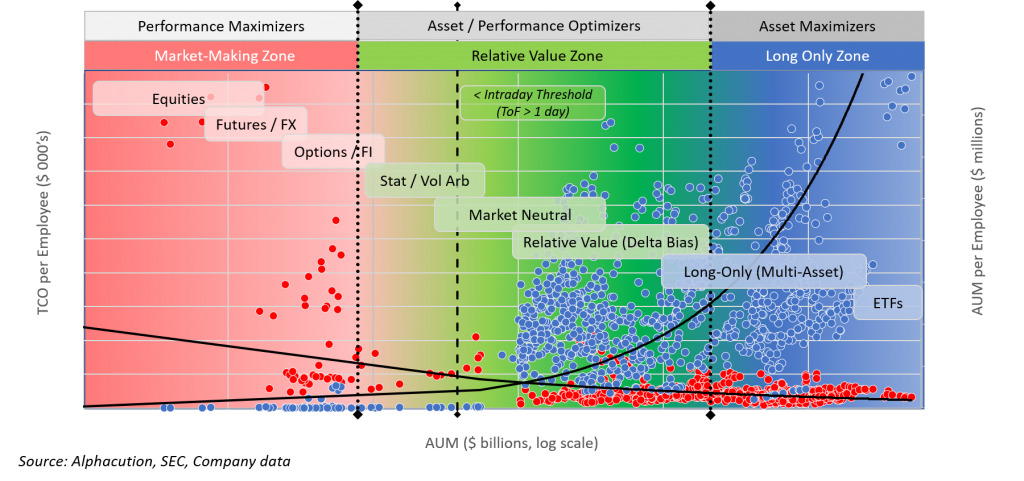
Like the methods for solving a Sudoku puzzle, this work results in the creation of a context machine – and its implications for optimizing the human – technology capital mix for specific managers and within specific strategies is worthy of attention. In parallel, it turns out that this framework is also a map. And, with the development of increasing contextual powers, Alphacution can make a rather bold claim: This map provides an increasingly specific “location” for every manager in the global asset management universe, no matter the strategy and no matter how secretive (see Exhibit 4). Stop guessing. Learn how…
Exhibit 4: Converting Framework into Map of Strategy Categories, Manager Coordinates


Alphacution Research Conservatory
Alphacution Research Conservatory (Alphacution) is the first digitally-oriented research and advisory business model focused on providing strategic intelligence about the economic impacts of technology and operational decision-making for the financial services ecosystem. Founded by Paul Rowady, Alphacution is specifically designed with a dual mission: 1) To deliver data-driven intelligence and uncommon perspective for data, analytics and technology themes related to the financial services industry, and 2) to leverage digital-era tools, technologies and methods in the development and delivery of its products and services, as well as to exemplify the cultural and organization dynamics that are integral to such an effort. Alphacution’s core research and advisory services are based on its composite modeling for technology total cost of ownership (TCO), operational analytics, business transformation and market sizing, including its T-Greeks Operational Analytics Framework for techno-operational benchmarking intelligence. More information can found at www.alphacution.com. Please send inquiries to info@alphacution.com and follow @alphacution.
Author – Paul Rowady
Paul Rowady is the Founder and Director of Research for Alphacution Research Conservatory, a company originally established in 2004 to develop visually-intensive trading and research systems. Prior to this, Paul spent 7 years with capital markets consultancy, TABB Group, where he was most notably the founding principal of its technology, analytics and data advisory practice. In total, Paul has nearly 30 years of research, technology, capital markets and proprietary trading experience with firms like O’Connor & Associates, Quantlab Financial, and Ritchie Capital Management; and has background in trading strategy research, risk analytics systems and operational development. He also has specific expertise in derivatives, highly automated trading systems, and numerous data management initiatives. Paul is a featured speaker at capital markets, data and technology events; regularly quoted in national, financial and industry media; and has provided live and recorded commentary for national and client media channels. Paul’s most recent research and consulting focus has related primarily to areas like technology spending measurement and benchmarking, digital transformation, big data analytics, high performance computing (HPC) technologies, OTC derivatives reforms and quantitative trading methods. He earned a Master of Management from the J. L. Kellogg Graduate School of Management at Northwestern University and a B.S. in Business Administration from Valparaiso University. He was also awarded a patent related to data visualization and information design for trading and research systems in July 2009.