
“Don’t get involved in partial problems, but always take flight to where there is a free view over the whole single great problem, even if this view is not a clear one.” – Ludwig Wittgenstein
As we build – and promote – our case to elevate Alphacution’s value proposition and research output to a more viable economic support model, we are beginning to focus on the development of deeper and more comprehensive premium content. This plan has been outlined in our recent Support the Feed! post, a portion of which will now be appended to the bottom of each new post going forward.
BTW, the sooner you respond to that plea in some way, the less likely it will be that I become increasingly obnoxious about the topic… 😉
Anyway, I had hoped to develop this case study on Spot Trading – a noted Chicago-based proprietary option-focused trading firm that closed at the end of 2017 – as an example of what we are able to highlight specifically in cases where there is opportunity for combined modeling of 13F and X17a5 reporting data. For now, this will need to be more of a teaser while we complete the development of the full Spot case study to be published in one of the upcoming newsletters, but here’s the central theme:
As a point of reference, the value of Spot’s portfolio peaked in Q2 2014 when their gross notional long market exposure reached $20.9 billion (spread out over about 4,500 positions), see below.
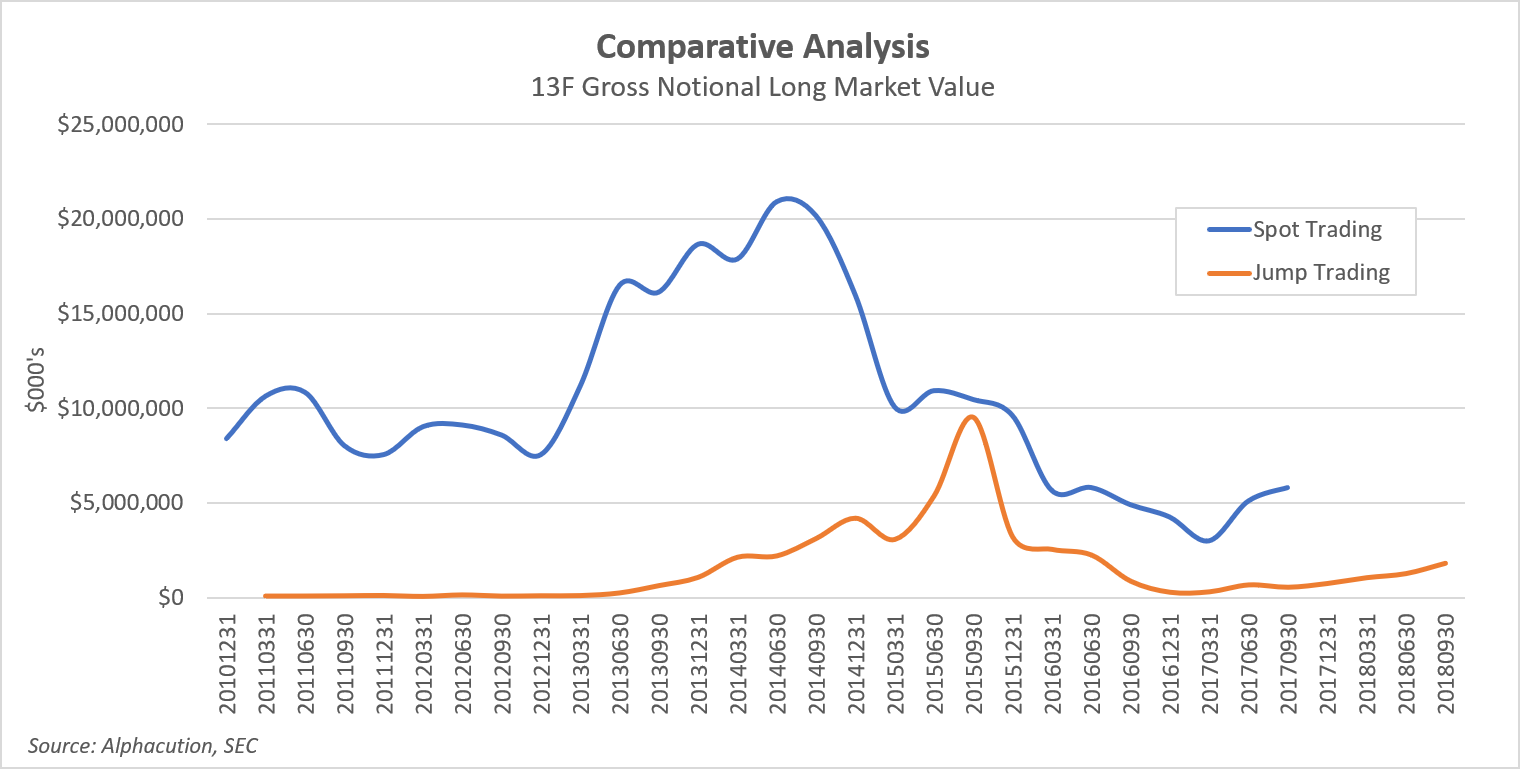
This level is shown in comparison to neighbor Jump Trading whose holdings have tended to remian in the sub-$5 billion range (with noted exception in Q3 2015) over a similar time period. Admittedly, Jump is not the optimal comparison in this case, since it is more of a high-frequency futures shop. Better comparisons will likely be found with Wolverine or Peak6, and we will present those comparisons once those additional models and analyses are developed.
In any case, when we look at the balance sheet (found in the X17a5 reports), we can see how the “long volatility” and “short volatility” sides of the book are matched up. Here, the securities owned side of the portfolio (including long call and put positions) and the securities sold side of the portfolio (including short call and put positions) both peak at around $3.5 billion in 2014, see below.
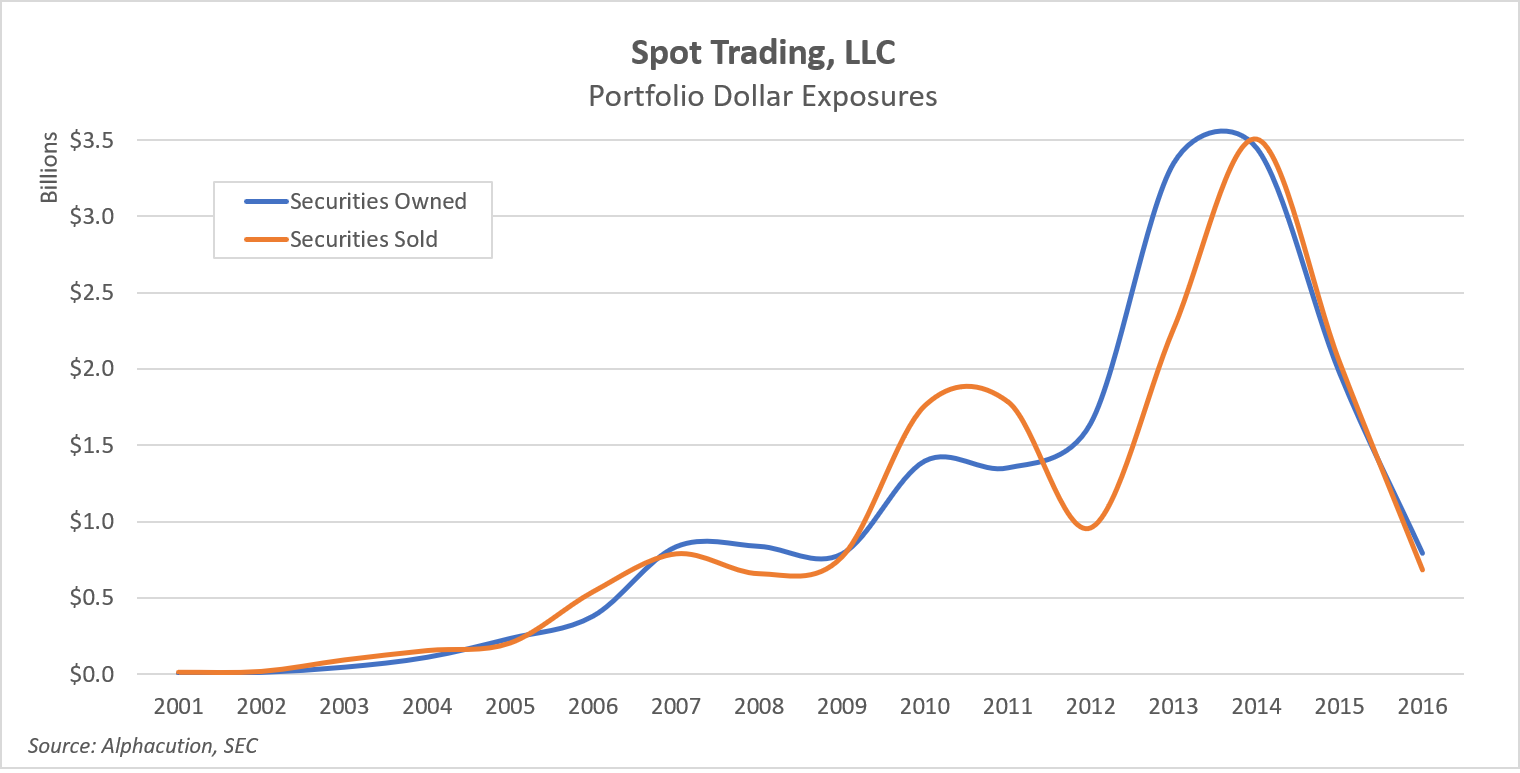
Note that these figures are delta-adjusted values as compared to gross notional long-side only values found in the 13F reports, which means that the gross notional and delta-adjusted perspectives on the book at running at a ratio of over 5:1.
Neither of these figures represent margin. Also note that while the 13F reporting does not begin until Q4 2010, X17a5 reports begin in 2001. Per the 13F filing rules, this suggests that Spot does not reach $100 million of “AUM” – in this case a more accurate proxy for margin – until Q4 2010.
Lastly, we are able to calculate the dollar neutrality of the portfolio for the period 2001 to 2016 from the x17a5 reports, see below:
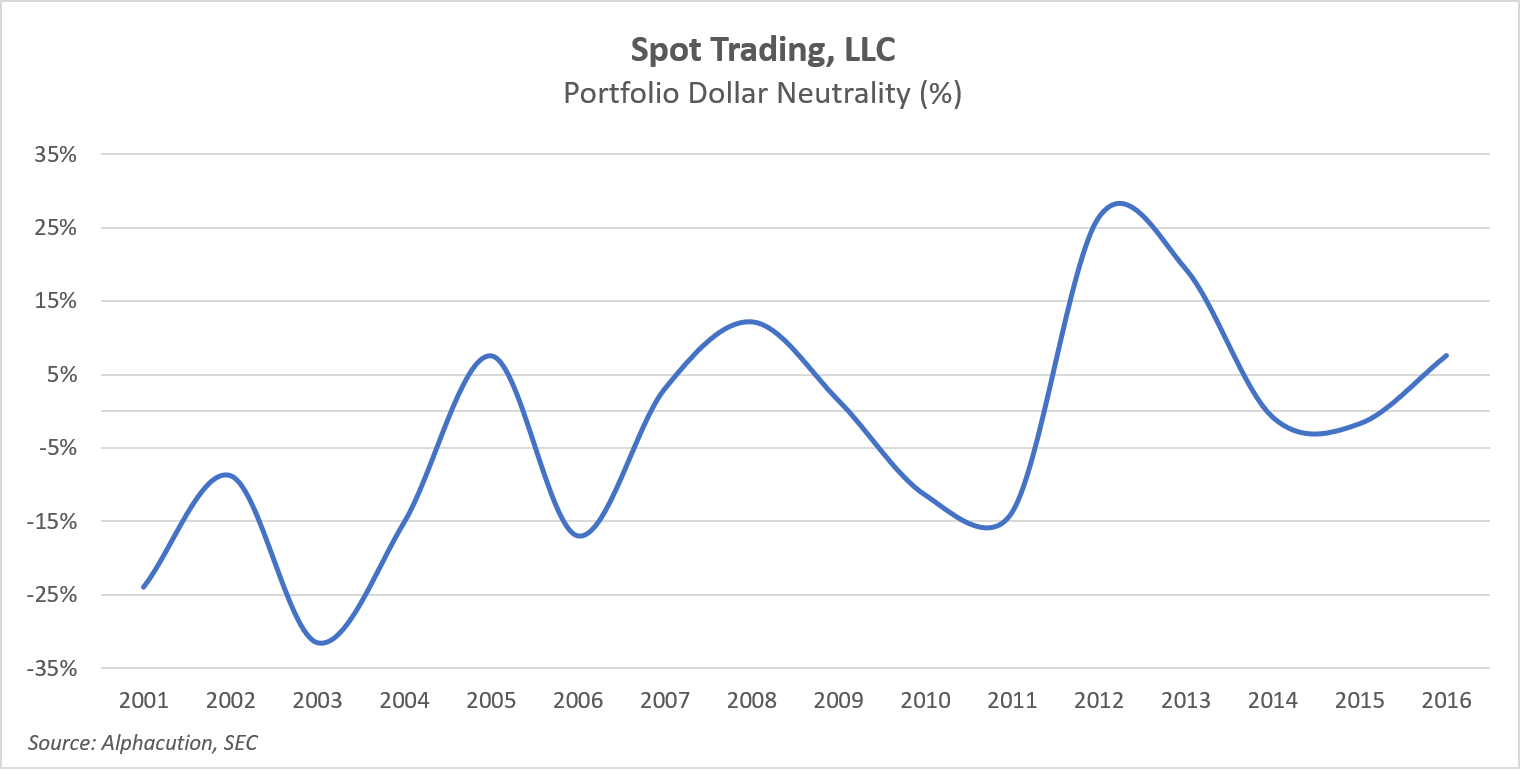
For this chart, we are taking the ratio of net dollar exposure to the gross (long vol + short vol) value of the portfolio over the reporting period. And, it is here that we may have found some evidence – a smoking gun, of sorts – for why Spot ended up closing its doors: The consistent oscillation in the level of short vol positioning to long vol positioning follows a trendline that does not appear to correspond to changes in underlying volatility (as illustrated by CBOE’s Volatility Index – VIX).
While it’s too early in our analysis to tell for sure – and respecting the fact that we may never really know – chances are from what we can see here that Spot’s portfolio construction (as it became bigger) was not matched up well with the eventual shifts in volatility. They were likely long vol when it was muted, and flat vol when it spiked.
Again, just some conjecture at this point. I’d like to build this one out a little further to demonstrate how various portfolios are constructed, how they are balanced (or not), how these factors shift through time, how these fragments of insight might inform us about the underlying profitability of various strategies, and what all that new knowledge may suggest about the nature of the underlying markets.
So much to discover! So much to learn! So much to share!
Watch this space…