
According to Al Pacino, as Coach Tony D’Amato in the movie, Any Given Sunday, “this is a game of inches – the margin for error is so small – and the inches we need are all around us.” With this in mind, it turns out that measuring technology spending in detail represents some of those so-called inches. Personally, I have found such an analysis to yield really incredible and exciting insights – representing more than just a few of those inches. Our TPE Dispersion Analytic – known as T-VOL™ – is one of the better specimen to support such a claim, at least so far. First, let me detangle some of the jargon so that you can see how (potentially) cool and useful this analytic could be:
We developed individual models of the largest banks in the world – currently numbering 51 – capturing financial and operational data over the pre- and post-GFC period, 2005 – 2014. For each bank, combining estimated non-human capital (NHC) technology spending with reported headcount for each year in the period yields a metric called TPE – technology spending per employee. (Note: Given the way headcount is typically reported, “employee” in this case is synonymous with full-time equivalent (FTE).) Next, the standard deviation of TPE over time – in this case, 10 years – yields TPE dispersion. We call this number T-VOL. When we rank T-VOL for each of the current bank models in our sample, the picture becomes quite fascinating (as originally promised):
Now, here’s how we envision a rubber-meets-the-road application of this type of analysis: Imagine that you are a business development executive responsible for selling solutions to large global banks and other similar financial institutions. Of course, your sales strategy leverages long-standing personal relationships, aggregated information about the inner workings of the prospective organization, and incremental intelligence from advisors and other third parties about the landscape, latest themes and new vernacular. A common strategy, for sure. And yet, sales cycles can remain long and often inefficient even if you have a strong product or service offering. Remember: This is a game of inches
ARC believes that more finely-tuned intelligence about prospective solution buyers can help with this; incrementally improving sales strategies and compressing sales cycles. T-VOL – the dispersion of technology spending per employee over time – is an example of such improved analytical intelligence. For instance, firms with high T-VOL rankings are likely to have a high degree of “operational distractions” and excessive indecisiveness, the highest of which are likely to be in outright disarray. In these cases, TPE is changing dramatically from year to year because of comparatively higher variance in headcount and/or outright technology spending. 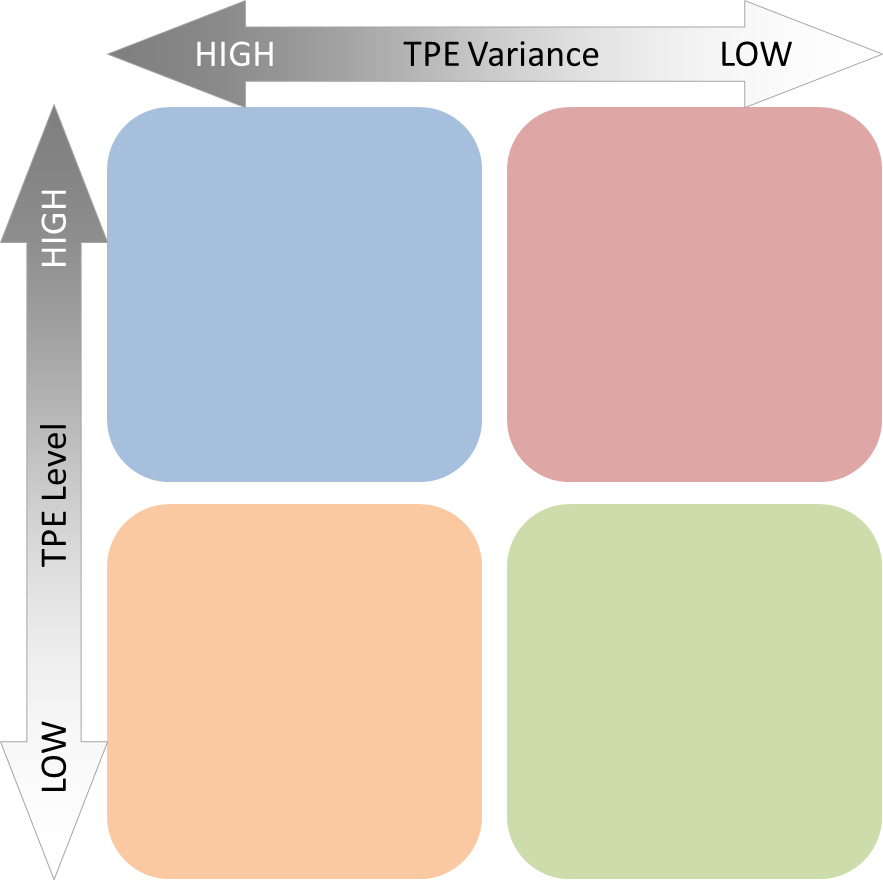 Low T-VOL rankings are more likely to be indicative of firms that are well-managed, visionary and decisive about technology solution purchases, particularly given the unprecedented transformation that has been occurring in the FSI ecosystem since 2009 on the back of mass regulatory interventionism and, more recently, given the palpable impacts of the ongoing digital revolution. Given the evidence we have harvested so far, it makes quite a statement to maintain consistent TPE levels through turbulent periods of the past 10 years. In some rare cases, it is almost as if such firms are purposely managing technology spending by this exact metric – which brings us to the final point(s):
There are 4 distinct buyer profiles – business mix, scale and geographic scope notwithstanding. The two axes that define these quadrants are TPE variance and the absolute TPE level, as follows:
Bottom line: While we will be developing significantly more intelligence around sales strategy analytics, for now it should go without saying that strategies that target firms with higher T-VOL vs. lower T-VOL should not be the same.