Image Credit: Fabian Oefner
“Research is what I’m doing when I don’t know what I’m doing…” – Wernher von Braun
Overview
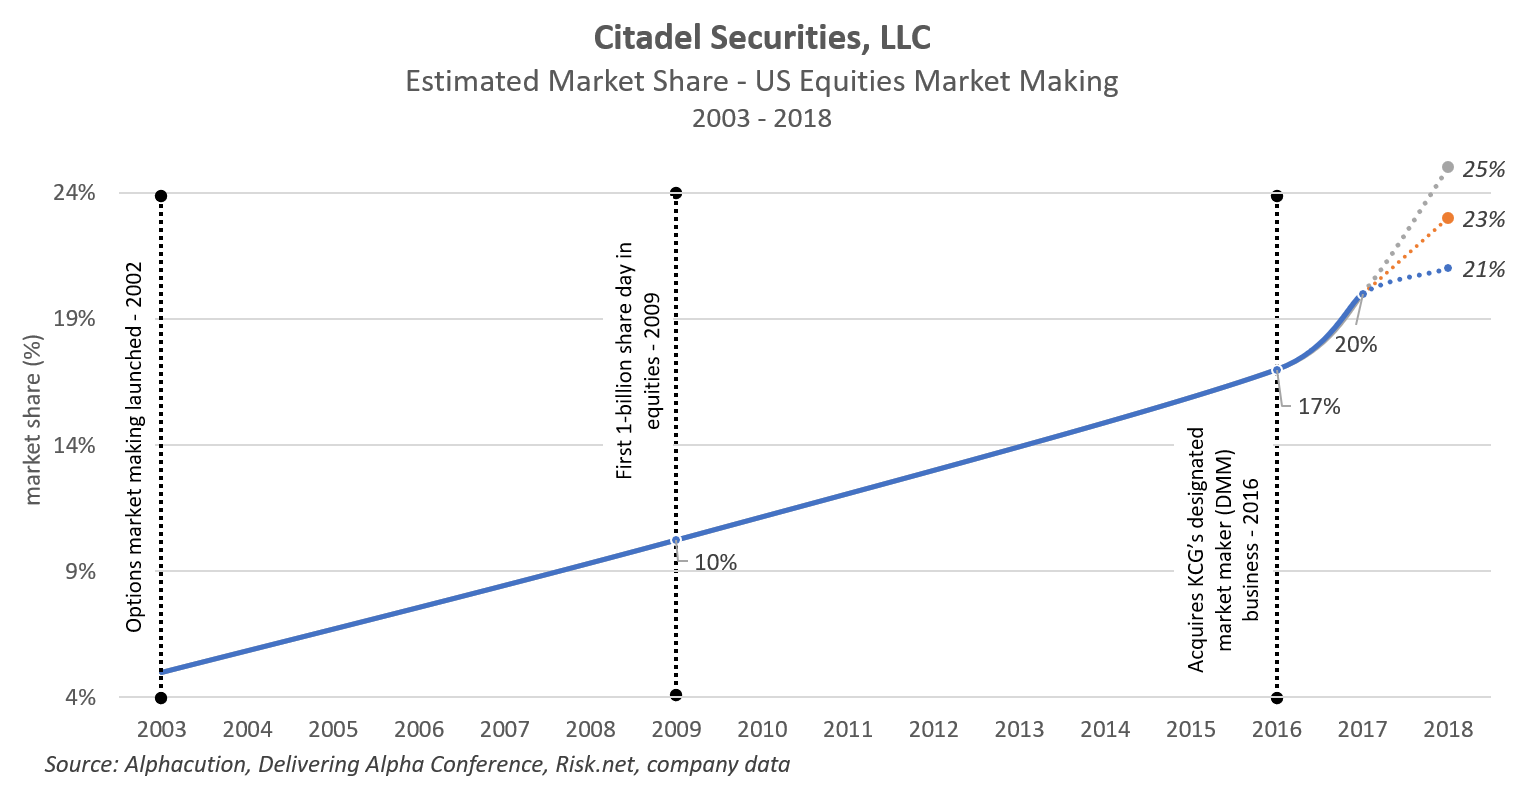
It was July 18, 2018. The scene was the 8th annual CNBC- and Institutional Investor-sponsored Delivering Alpha Conference. One of the main highlights of the event is Andrew Ross Sorkin’s fireside chat-style interview with Citadel founder, Ken Griffin. Among the many topics covered, the discussion confirmed that “1 out of every 5 stocks is trading through Citadel Securities.” In complement to this claim, a Risk.net article, dated November 27, 2018, further revealed that Citadel Securities’ “total market share in US equities now exceeds the 20% it had 12 months ago and the 17% it clocked two years prior.”
Assembling these disparate fragments together with a few additional clues of data lifted directly from the Citadel Securities website, it is possible to illustrate a very impressive path that culminates, in Alphacution’s estimation, at a US equities market share of between 23.5% and 25%, as of the end of 2018, based on the prior year-over-year growth rate. This achievement is otherwise known as a market share now closer to 1 out of every 4.3 shares traded (see Exhibit 1, below).
But, of course, there’s always another side to the proverbial coin: Later in the Delivering Alpha interview, Mr. Griffin underscores his long-held position that “competition creates value for consumers” and “there’s always room for more competition.” Now, if you detect the paradox in these opening statements – the one that exists between high levels of market concentration and the value of more competition – then you are already tuned in to a central theme of the story we are about to present here. To his credit, Mr. Sorkin eventually points out this paradox during the interview. Mr. Griffin’s response to being called out on the apparent contradiction is something we are going to bookmark for later…
Legend in the Making
The early highlights of Citadel are well established among students of the hedge fund and proprietary trading arenas; and, given the extremes of financial and technological success that have taken root here, they are well known to much of the broader financial services industry, too. Certainly, recent tales of the founder’s trophy-hunting exploits in residential real estate have helped to fuel the latest potency of ongoing mystique and mythology surrounding the organization.
Founded in 1990 by 21-year old Harvard University student, Ken Griffin, and initially based on a convertible bond arbitrage strategy, Citadel[1] has consistently evolved in a manner that solidifies its reputation as one of the most legendary trading and asset management powerhouses of the modern era. For example, as of 2017, Citadel’s hedge fund business was ranked by Institutional Investor as #3 in the category of all-time profits since launch, trailing only Ray Dalio’s Bridgewater Associates (#1) and George Soros’ eponymous Soros Fund Management (#2). If you’re into forecasting, this achievement is made by a firm that is 15 and 17 years younger than the other legendary managers it trails in this category, respectively.
Today, this very same hedge fund side of the business – managed by another legal entity known as Citadel Advisors, LLC today – sits atop an estimated $30 billion in assets under management (AUM), putting it at #11 in a ranking of top hedge funds by AUM (trailing Seth Klarman’s highly-concentrated, long-only, debt-focused hedge fund management platform, Baupost Group, Inc., at #10), according to Q2-2018 data from Pensions and Investments.
Headquartered in Chicago, with satellite operations spanning key global financial centers, Citadel’s broad portfolio of market strategies is rivaled by few, if any, others. And with limited exceptions (such as digital assets, to date), Citadel – both the market making side as Citadel Securities LLC and the hedge fund management side as Citadel Advisors LLC – is active in most cash, derivative, listed and OTC markets for financial and commodity products around the world, typically on the cutting edge of the most automated and data-intensive methods possible. To economize on words for a change: They trade just about everything that moves with unrivaled quantitative, automated and technological prowess. Pick your category…
On this basis, and despite profound dominance in US listed equity markets, Alphacution has historically argued that there is actually no core strategy here. In fact, we believe that Citadel’s “secret sauce” – the blessing (and the curse) that Ken Griffin has bestowed upon and infused throughout the only place he has ever worked – is a maniacal sensitivity to processing. Moreover, we believe this is true no matter the underlying product, asset class, region, or set of signal-producing inputs. The application of intelligence in global markets based on unprecedented data management assets and human capital skills is at the heart of everything that Citadel pursues – and the results, including the expansive and expanding trophy case of its founder, speak volumes.
So, it is with this brief prelude of mostly retreaded scores and highlights as backdrop that we embark upon our mission to tell a version of the Citadel story that has never been told before because it is based on an assembly of their data that has never been assembled like this before. Thankfully, our accomplice for this mission is the subject of the story itself.
Nested Strategy Architecture
Alphacution’s version of the Citadel story is being underwritten by the substantial regulatory data exhaust from the operating engines of the company itself. It turns out, if you know where to look, there is significant amounts of data – that which is related to Citadel and many other of the most profitable, impactful and mythological entities in the financial universe – hiding in plain sight. All you need is the patience, tenacity, vision and experience to assemble that cache of freely-available data into a storyboard that is more easily consumable by a larger audience than the raw forms of that data initially allow.
This is precisely what Alphacution has done here. At the core of this story is a case study on Citadel Securities, LLC; the market making and proprietary trading business that, on the one hand, stands as a separate and distinct trading business from Citadel’s hedge fund operations (known henceforth in this report as Citadel Advisors, LLC) and yet, on the other hand, Alphacution believes plays a critical, symbiotic role in the overall success of the broader Citadel trading and asset management empire.
Distinguishable as a unique subset of multi-strategy managers, we have observed similar patterns – otherwise potentially described as a meta-strategy of nested alphas – across separate and distinct legal entities on the sell-side, with the likes of UBS, Morgan Stanley, Goldman Sachs and others; and on the buy-side, with the likes of Susquehanna International Group (SIG), Jane Street Group, and Wolverine Trading – and further believe, for example, that Two Sigma’s late 2017 acquisition of Interactive Broker’s option market making operation, Timber Hill – and Hudson River Trading’s early 2018 acquisition of Sun Trading (to form HRT Execution Services, LLC) – were both bids to emulate this type of nested strategy architecture.
Now, a deep and tedious dive into the details of a nested strategy architecture are better placed in a separate document – and not smack-dab in the middle of the full-bowl-of-popcorn stage of our story – but, here’s the primary driver behind aligning a series of strategies in a complementary manner: Each of these firms understand, and closely monitor, the fact that strategy capacity is inversely related to position holding period – or, trading turnover frequency (ToF), which is roughly defined as the number of times the value of a portfolio is traded per year. Simply put, the boundary conditions are such that high turnover strategies yield low relative capacity; low turnover strategies yield high relative capacity. Because traditional, human capital-intensive strategies – like those cultivated by the original hedge fund pioneers George Soros, Michael Steinhardt or Julian Robertson, Jr. – rarely needed to consider capacity constraints, highly-automated strategy managers were typically the first to consider the idea of strategy capacity. It naturally follows that when successful managers discovered the capacity of their initial strategy (typically as indicated by higher costs and/or decaying performance) the question of the next most optimal strategy choice comes to a head: Is the adjacency of the next best strategy choice serial (as in adjacent turnover frequency) or parallel (as in, adjacent product class, asset class or region)?
We will reserve further discussion about serial vs. parallel strategy selections other than to illustrate the complementary nature of a nested strategy architecture in Exhibit 2, below:
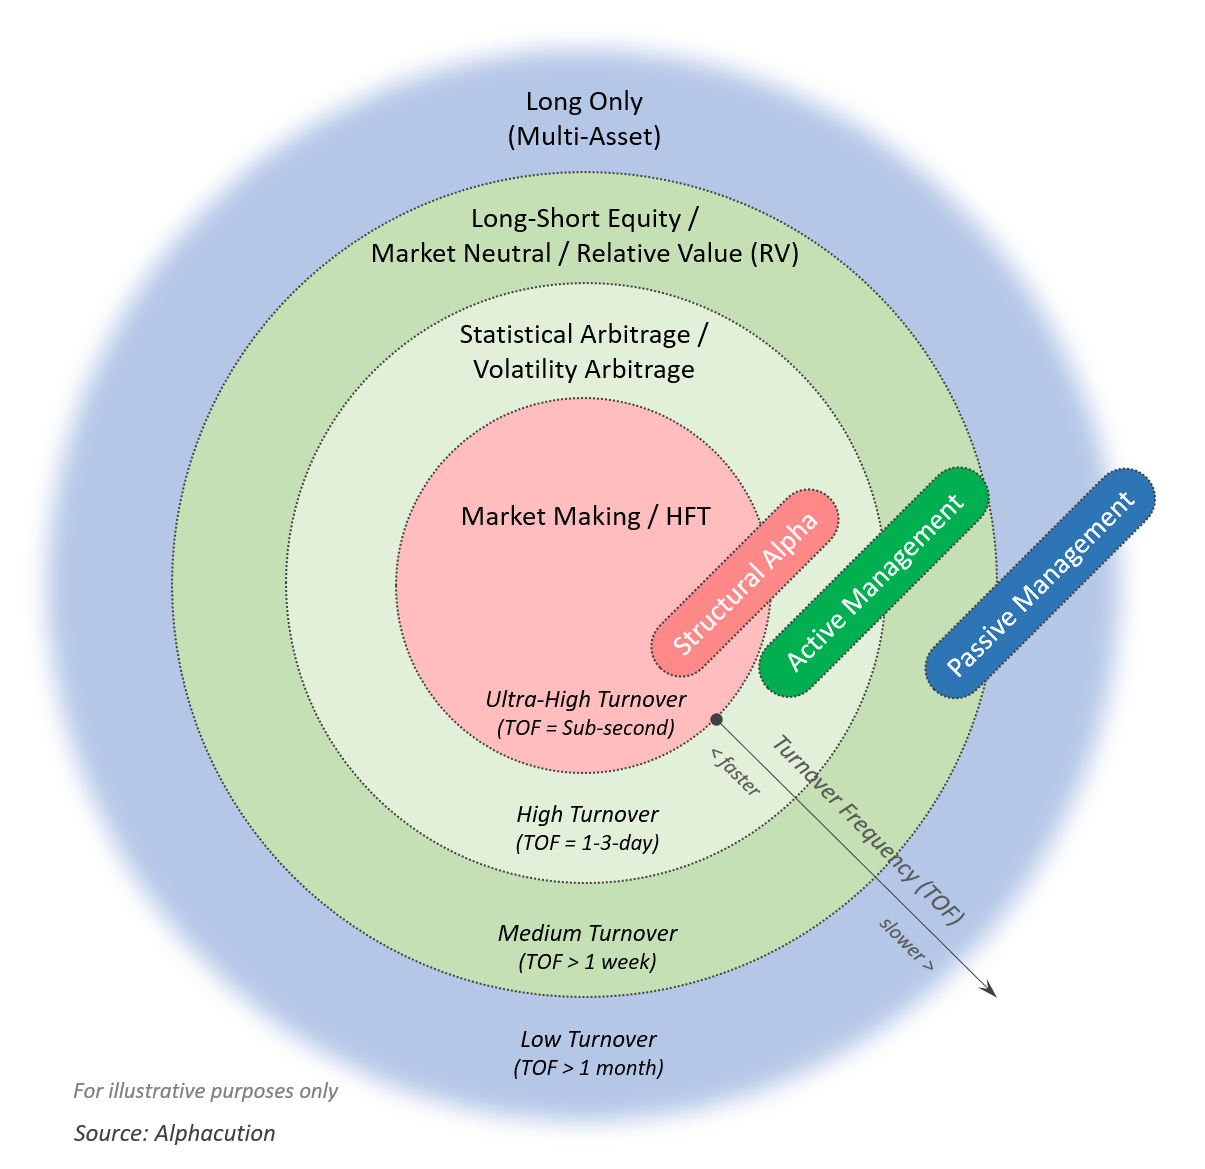
Much more importantly, the idea of coordinating strategies by relative trading turnover frequencies – or, sequentially-aligned temporal waves of theoretical alpha – in order to optimize transaction costs, market impact slippage, margin efficiencies and any overlapping cost of data inputs for signal production is not particularly new, as was exemplified by the Andy Sterge-led BNP CooperNeff quant derivatives operation of the late 1990’s.
So, in short, we keep the focus of this case study tied to Citadel Securities precisely because the best version of the story cannot be told any other way. They are at the center of the entire trading platform, not off to the side, functioning as some parallel component of the organization. They are the central execution engine – and the whole platform is much more successful because of it.
Now, in order to better understand and appreciate Alphacution’s perspective on Citadel – including its elaborate constellation of related legal entities – we recommend that you first consider a very wide-lens perspective of the market ecosystem itself. In a sense, we believe that it is important to see it – and other market participants – as behaving like living organisms that are responding to, adapting to and incrementally influencing their environment. A framework hypothesis governing such patterns of behavior (i.e. – strategy selections) was proposed and initially validated in our study, “The Context Machine: Estimating Asset Manager Technology Spending,” and the prophetically-named post to our Feed that introduces that work, “What Does Citadel* Spend on Technology?”
Of course, this non-linear and non-stationary – “living, breathing” – aspect of the global markets ecosystem has always been present to one degree or another. It’s just that today the data, technical leverage and experiential overlay has accumulated to the point that we can make a clear-enough sketch of it. In time, Alphacution’s vision is to take advantage of expected improvements in each of these factors to evolve these initial sketches to the point of a real-time and interactive “movie” of the macro-to-micro structure of the global markets universe. Today, like the health of a coral reef, the size, quantity, diversity, and other key attributes of the players, products and strategies thriving and decaying within the financial ecosystem are all sources of operational data exhaust that can incrementally and collectively help us sketch the aforementioned picture with increasing precision and accuracy.
And, though there are numerous, relatively generic versions of, say, long-short equity hedge funds or “smart beta” asset managers, there is only one organization in this ecosystem that is configured quite like Citadel. When more of our modeling is complete, it may turn out to be the global markets’ incarnation of a Night Fury dragon. There is only one – and its ongoing success, given the winner-take-all dynamics of this tech-centric era, may ultimately turn out to be more of a competitive threat to many of the remaining players – and the overall health of the ecosystem – as it is an example worthy of admiration and mythology.
Asset Management Ecosystem Map
There is one more cornerstone of contextual understanding that we need to put in place before jumping into Citadel’s business and trading strategy specifics. Alphacution’s trading and asset management ecosystem map starts the process of segmenting all market participants into three primary strategy zones based on coordinates established by measures of the two, and only, engines of productivity: technology and human capital. In other words, all workflows are woven together with a unique mix of technology-centric and people-centric tasks.
This seminal research supports the hypothesis that trading and asset management firms display operational attributes – patterns that are indirectly related to market risk strategies – that can be aligned in a schematic based on implied levels of workflow automation. In the version of the map, below, we place specific emphasis on the structural alpha zone – including Alphacution’s rendering of all US listed market liquidity pools – to emphasize a corollary hypothesis that a substantial yet finite (and theoretically-quantifiable) portion of available alpha capacity is transactional in nature, and therefore, discovered and captured only in closest proximity to the sources of liquidity.
Exhibit 3: Asset Management Ecosystem Map – Focus on Structural Alpha Zone (v1.1)
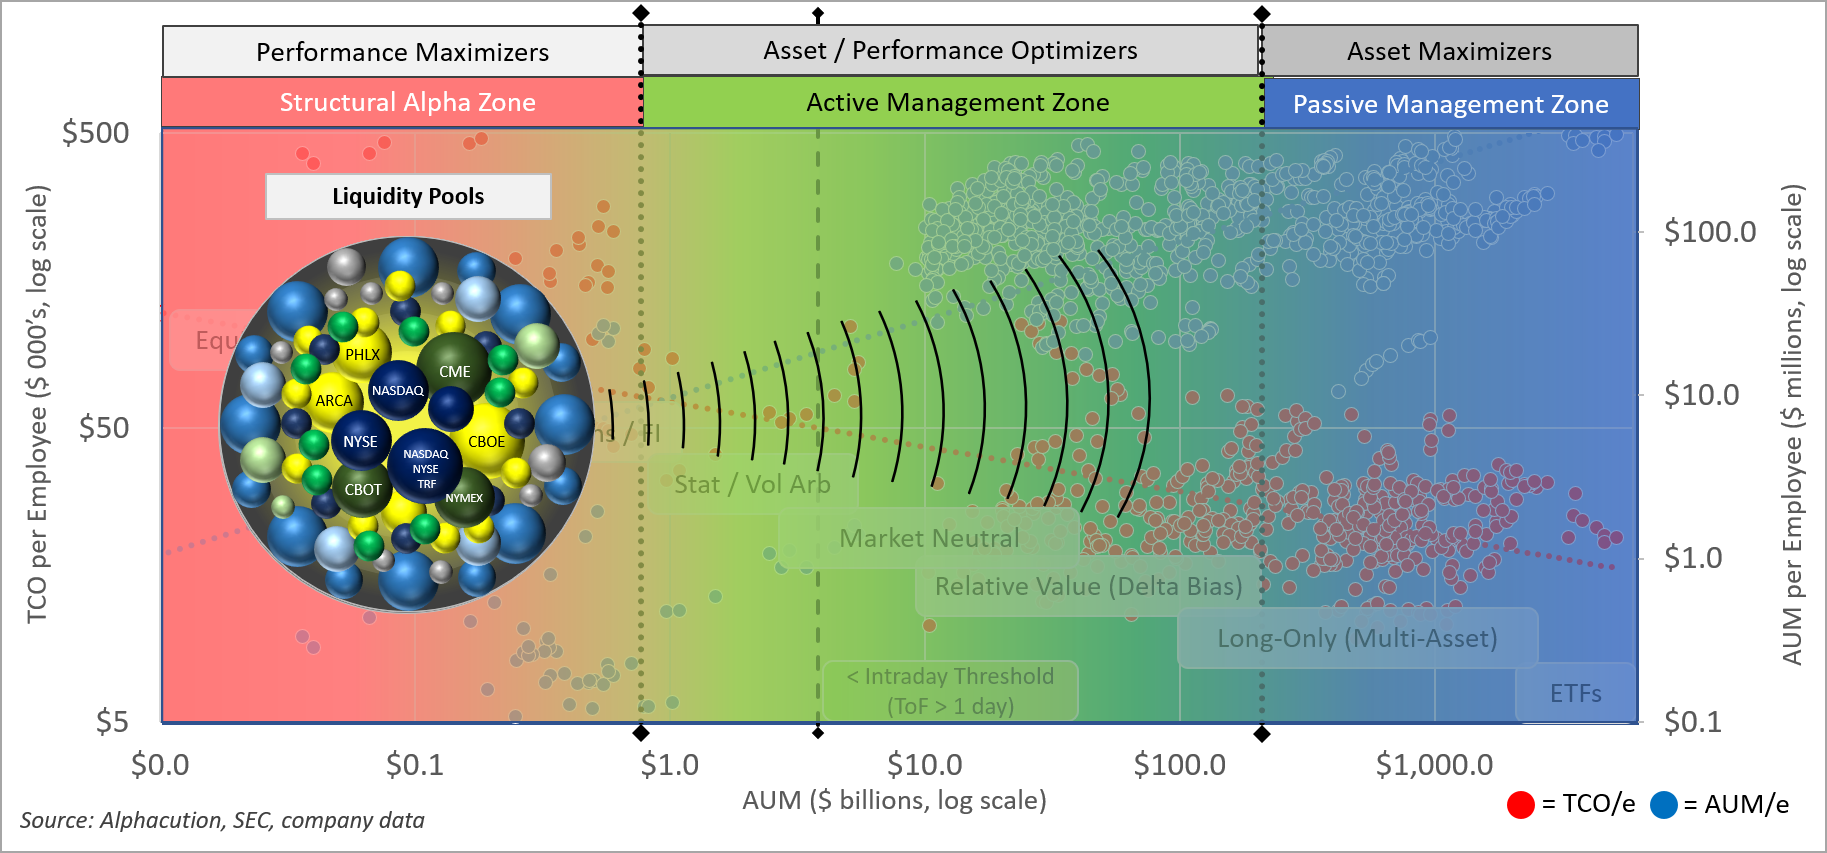
The expanded takeaway from this map metaphor is this: Those firms that operate closest to the sources of listed liquidity tend to emit similar operational attributes. Among these are high technology spending, high workflow automation, and low headcount – which tips the hand that each is executing the most active trading strategies along the full spectrum of investable strategies. In short, strategy selection is correlated to these other factors, namely the technology-human capital mix. Moreover, to harvest the benefits of being in closest proximity to liquidity (i.e. – transaction cost and margin advantages, among others), each of these trading operations also tend to have similar regulatory disclosure requirements.
This is because US broker-dealers – who are governed by the Securities and Exchange Commission (SEC), Financial Industry Regulatory Authority (FINRA) and Securities Investor Protection Corporation (SIPC) and are required to file a FOCUS report on Form X17A5 – that are also active enough to be accumulating positions (to a point that triggers the requirement to file a quarterly 13F holdings report with the SEC) tend to be among the largest market makers and proprietary trading firms. These are the same firms who operate in the region of the ecosystem where the pressure to minimize trading costs – namely, transaction costs, market impact slippage and margin efficiencies – is the highest. In short, these creatures need to live in a climate where their specific brand of “food,” with specific “nutritional content,” can be found in abundance.
Based on our broader ecosystem map and the concepts behind the operational acclimations within specific zones on that map, Alphacution has developed a series of schematics that initially identifies the “Top 100 Players in US Listed Market Structure” – including US equity exchanges, sell-side liquidity venues (a.k.a. – “dark pools”); independent, agency, and consortium dark pools; non-bank single dealer platforms (SDPs) and the Tier 1 buy-side and sell-side players that are the primary sponsors and market makers that interact with these sources of liquidity.
That research and modeling culminates to date in the illustration that can be found in Exhibit 4, below. It is here, given the proximity to and prowess around the listed sources of liquidity – and not necessarily as a result of the impressive legacy of its flagship Kensington and Wellington hedge funds – that Alphacution believes Citadel Securities has helped establish and solidify the broader organization’s market-dominating position.
Exhibit 4: Top 100 Players in US Listed Market Structure Schematic (v1.0)
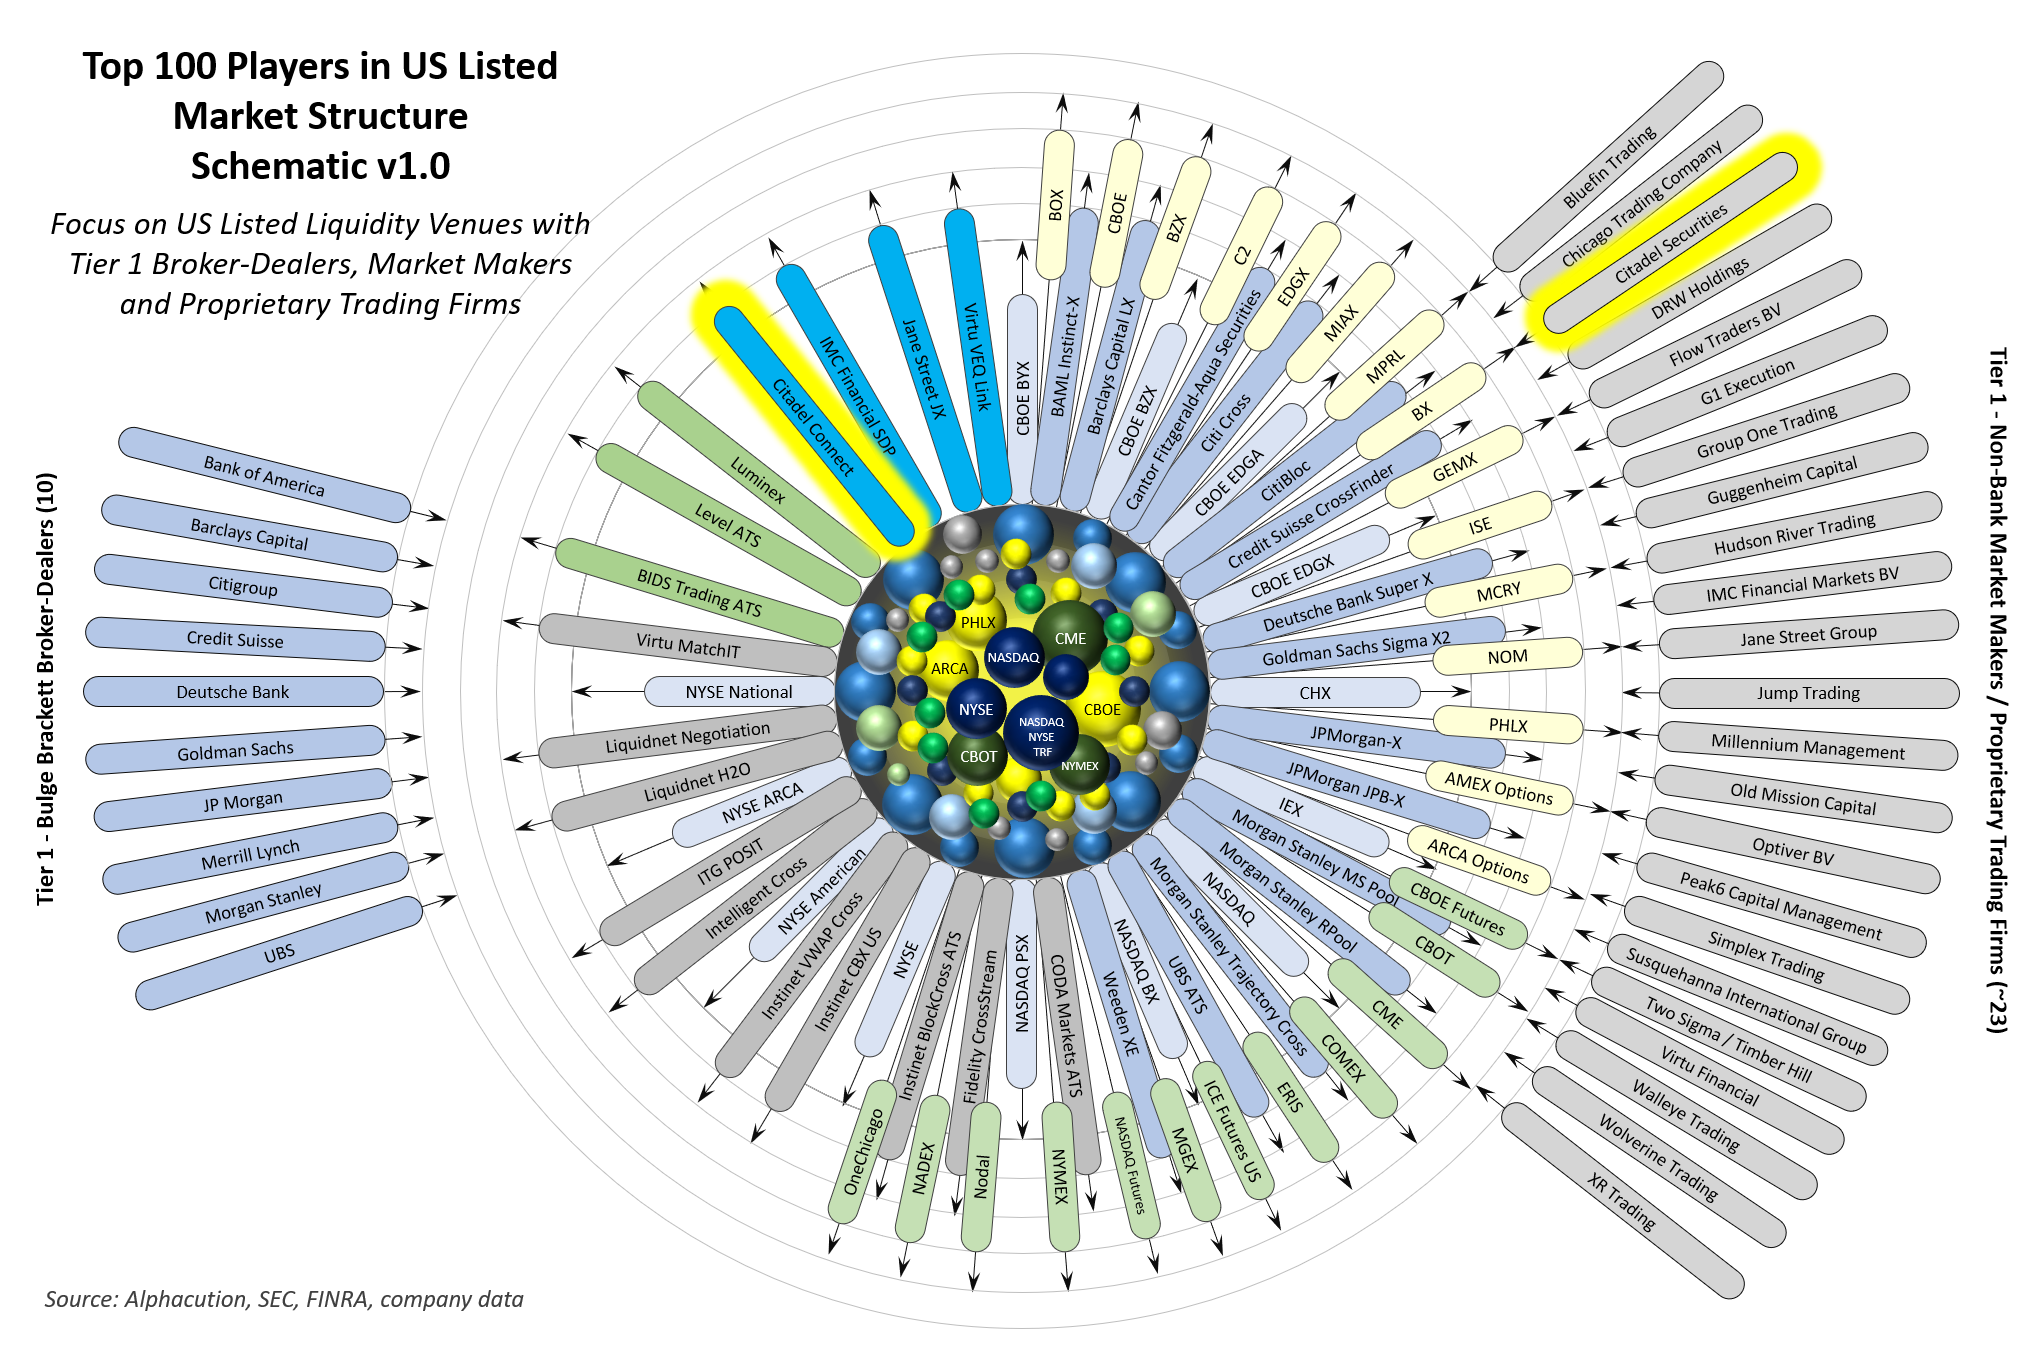
With Citadel Securities heading the list, Alphacution’s near-term research focus on leading market makers and proprietary trading firms is born out of this central idea:
If the capacity of alpha is finite, and a subset of leading market makers and proprietary trading firms (and select quantitative hedge funds) are capturing an increasing portion of that finite alpha capacity in the “structural alpha zone” by deploying increasingly automated and sophisticated trading engines, then what happens to the declining residual capacity of alpha in the neighboring active and passive management zones?
Alphacution expects that many market actors and their stakeholders are going to be fascinated by attempts to answer these and similar questions because 1) it has never seemed more necessary to ask them until now, 2) the success, if not the survival, of their businesses may depend on finding answers to them, and 3) there is no other research platform developing a framework to deliver credible answers to questions like these.
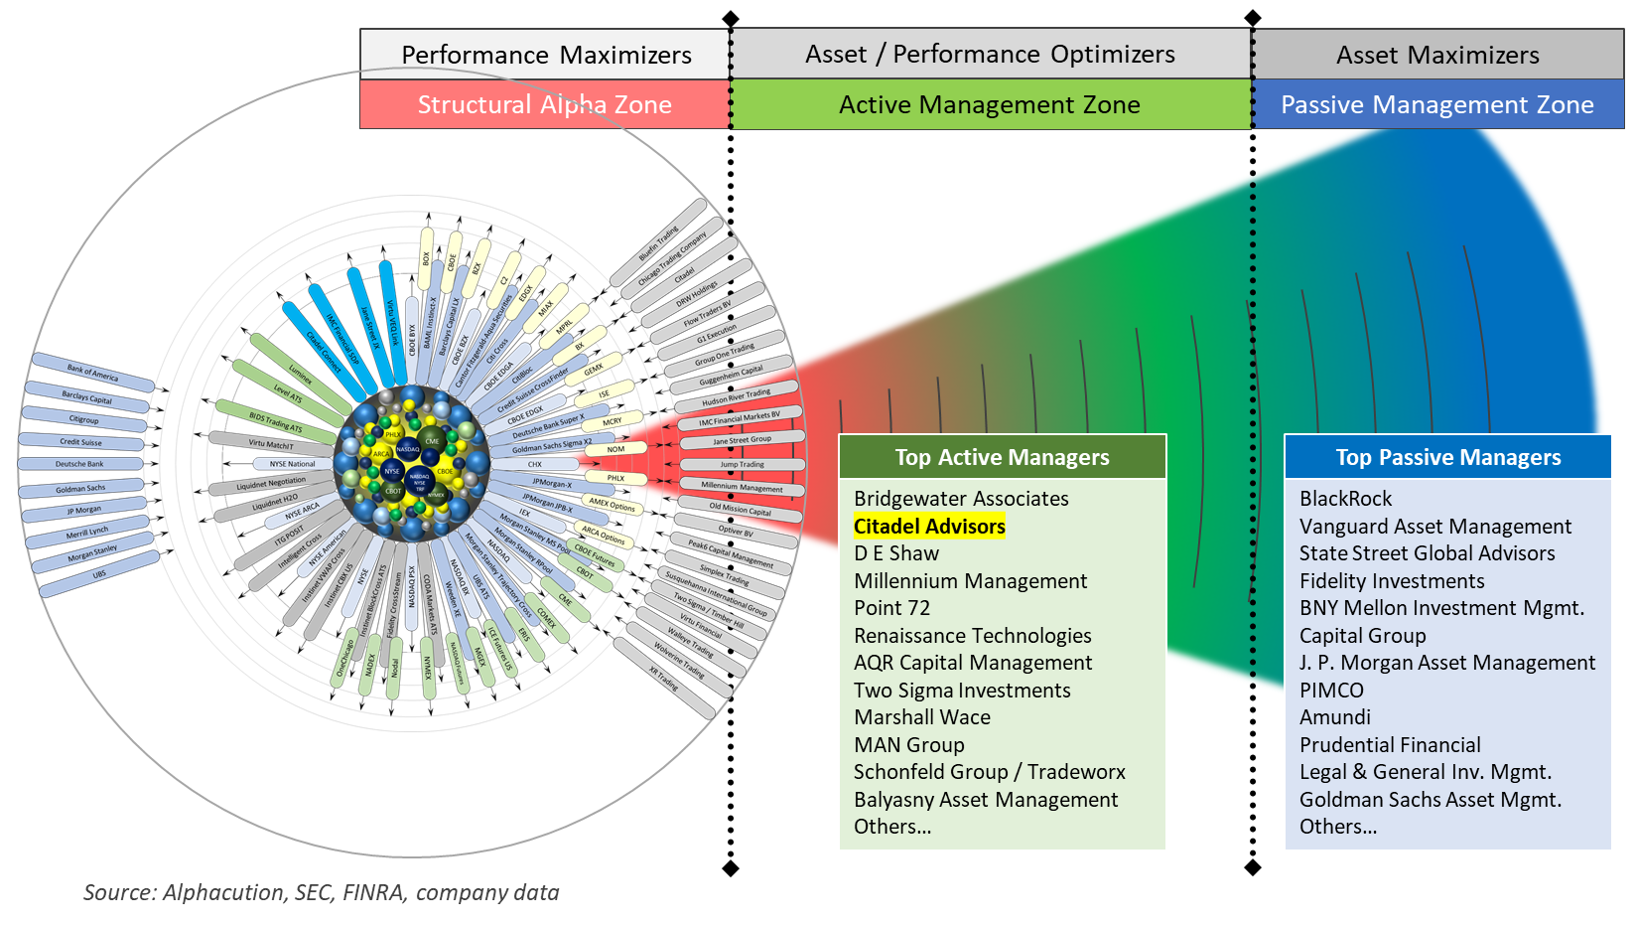
The following illustration is the next in the series of visual metaphors for the data-driven model that Alphacution is developing to quantify these phenomena. Its goal is to portray the market ecosystem as a series of symbiotic rings whereby the alpha capacity in the outer rings – the active and passive management zones – is influenced by the market structure, players and strategies deployed in the inner ring – the structural alpha zone.
Exhibit 5: Asset Management Ecosystem Map – Expanding Schematic into Active and Passive Management Zones
The Privatization of Alpha?
Recall that according to Institutional Investor’s 17th-annual Hedge Fund 100 ranking of the largest hedge fund firms in the world as of year-end 2017 that a short list of quantitatively-oriented managers were increasing their dominance over the market landscape:
“A handful of quantitative firms have continued to gobble up large sums of assets, catapulting many of them to the top of [the rankings]. The four biggest hedge fund firms — and five of the six biggest — on this year’s ranking rely largely or fully on computers to make their investment decisions and have continued to attract assets in spite of underwhelming performance in some cases. At the same time, many other well-established, recognizable firms with long track records have once again suffered a sharp reduction in assets or are shutting down altogether.”
The five firms at the top of the 2017 rankings were:
#1. Bridgewater Associates, (~$125 billion)
#2. AQR Capital Management (~$90 billion)
#3. Renaissance Technologies (~$57 billion)
#4. Two Sigma Investments (~$52 billion)
#6. D.E. Shaw & Co. (~$39 billion)
More recently, Institutional Investor reported that hedge fund launches had hit an 18-year low. So, when we combine the phenomena of market dominance by those successfully wielding systematic methods with the relative hollowing out of the hedge fund and asset management rosters (based on launches, closures, exits and consolidations), it makes us wonder if something unprecedented is happening in the overall trading and asset management ecosystem, out in the open, and right before our eyes.
The overarching idea – and the primary source of inspiration for Alphacution’s research – comes back to the fact that technology strategy, increasingly, is business strategy. We believe that technology is continuously and permanently changing the nature of trading and asset management (and banking) – and one of the most prominent symptoms of that evolution is the implied consolidation of players with increasing market share. Of particular relevance to this case study, Alphacution believes that Citadel is operating at the forefront of this phenomena.
So, with all that said, this research – and the incredibly unique story contained herein – has been developed to 1) share incremental evidence about the impacts of technology on market structure, participant concentration, and strategy evolution; 2) demonstrate the uncommon level of insight that can be assembled by applying an experiential overlay to a collection of raw and disparate datasets, all of which at this stage of development are freely open to the public; and, 3) educate our clients, subscribers and broader network of interested parties about the mechanics and drivers of Alphacution’s modeling of market macro-structure.
Case Study Data Sample
The storyboard and select findings contained in this report represent our interpretation of Citadel Securities’ trading and, by implication, business strategies. The supporting data sample is comprised of the following:
- 165 quarterly 13F[2] holdings reports (including 13F-HR/A amendment reports) for the 84-quarter (or 21-year) time range beginning March 31, 1998 (or, Q1 1998) and ending December 31, 2018 (or, Q4 2018) by the Citadel Advisors, LLC lineage of trade reporting entities;
- 17 years of FOCUS reports (on Forms X17A5 and X175/A) for the years ending December 31, 2003 thru December 31, 2018 filed by Citadel Securities, LLC (and the predecessor entity, Citadel Derivatives Group, LLC) with the SEC, FINRA, SIPC;
- 12 full account reports for the years ending December 31, 2006 thru December 31, 2017 filed by Citadel Securities (Europe) Limited with the United Kingdom’s registrar of companies, Companies House;
- Contextual modeling, exhibits, case studies, Feed posts and/or any other pre-existing content from Alphacution’s research library focusing on the evolutionary impacts of technology on global financial markets and the trading, asset management, and banking businesses they serve; and,
- Any other data or content referenced in this report that was searchable on the surface internet.
No representative of Alphacution has spoken to any representative of Citadel or affiliated entities for the preparation of this report. This report is solely based on the author’s interpretation of Alphacution’s ongoing assembly of raw data, contextualized modeling, and pre-existing content.
Footnotes:
[1] Citadel is legally now known in the US as Citadel Enterprise Americas, LLC and includes a vast and complex global lineage of predecessor and currently active affiliates. For the remainder of this report, the ultimate parent organization will be known simply as Citadel or the Citadel Lineage.
[2] Form 13F is a quarterly report filed, per United States Securities and Exchange Commission regulations, by “institutional investment managers” to the SEC and containing all position-level equity assets under management of at least $100 million in value with relevant long US holdings. All US-listed equity securities (including ETFs, equity options, and convertible bonds) in the manager’s portfolio are included and detailed according to the issuer name, security description, the security identifier (i.e. – CUSIP number), position value, number of shares, and other attributions.
As of December 31, 2018, Alphacution estimates that the full list of securities currently covered by Form 13F includes 17,264 securities. Short positions are not required to be disclosed and are not reported. Form 13F covers institutional investment managers, which include registered investment advisers (RIAs), banks, insurance companies, hedge funds, trust companies, pension funds, mutual funds, among other natural persons or entities with investment discretion over its own account or another’s. Form 13F is required to be filed within 45 days of the end of a calendar quarter. Find more about the 13F dataset on the Alphacution Feed.