
“Research is what I’m doing when I don’t know what I’m doing…” – Wernher von Braun
Overview
The modern capital markets era begins in the mid-1970’s with the emergence and then convergence of three critical factors: derivatives, computers and data feeds. Together, these factors symbolize the birth of the quantitative research revolution and beginnings of trade workflow automation, and therefore, propel the conception of some of the most consequential product developments, trading strategies and trading firms that the financial world has ever known.
A subset of the most notable players were the pioneers in the emerging listed option market. In some ways, they were also the pioneers in quantitative research – the “first quant shops” – developing advanced capabilities in the modeling of option pricing frameworks by way of computers and mathematics. Of these, the primary leaders included Chicago’s O’Connor & Associates (OCA), founded 1977; Chicago Research & Trading (CRT), founded 1977; and Hull Trading, founded 1985. Philadelphia was strongly represented by Cooper Neff & Associates, founded 1981; and, Susquehanna International Group (SIG), founded 1987. There were a few others worth mentioning in this initial phase; John Stafford Jr’s, Stafford Trading and Lee Tenzer’s LETCO among them.
With only one exception, all of these pioneers were eventually acquired by banks, starting with NationsBank’s acquisition of CRT in 1992. OCA’s acquisition by Swiss Bank Corp. (SBC) followed shortly thereafter (with that union later becoming part of UBS when it merged with SBC in 1997). BNP acquired Cooper Neff in 1995. Goldman Sachs acquired Hull Trading in 1999. And, TD Securities, a unit of Toronto Dominion Bank, simultaneously acquired Stafford Trading and LETCO in 2002 following the dot.com options frenzy of 2001.
That exception – the only one of these firms to remain independent and privately held since inception – is Susquehanna International Group, otherwise known as “SIG.” Today, SIG is one of the most powerful players in listed derivative markets around the world, specializing in market making and proprietary trading across asset classes and regions, and including private equity and venture capital.
The story we are about to tell here – based on an assembly of publicly-available data and modeling of comparative companies to date – is one that has never been told quite like this before. Based on a deconstruction of their full series of holdings reports (on Form 13F-HR) and broker-dealer FOCUS reports (on Form X-17A-5), this story is based on Alphacution’s interpretation of some of the data that illuminates SIG’s business and trading strategies.
All that said, the proper way to begin this story is by setting a stage and drawing a backdrop…
Structural Overview
SIG has been around for over 30 years. Our experience is that the longer firms are successfully in operation the more complicated they tend become, both in terms of roster of legal entities and in terms of strategy mix. SIG is no exception. So, for starters, we need to establish a structural outline of the company in order to demonstrate which components have the greatest impact on the implementation of trading and investment strategies – and, which components can be set aside, for now.
From the regulatory data to which we have access (which does not cover all activities of the company) there are numerous legal entities. In Exhibit 1, below, Alphacution lists (in alphabetical order) the nine broker-dealer affiliates of SIG that were in operation during some or all of the reporting period 2001 thru 2018.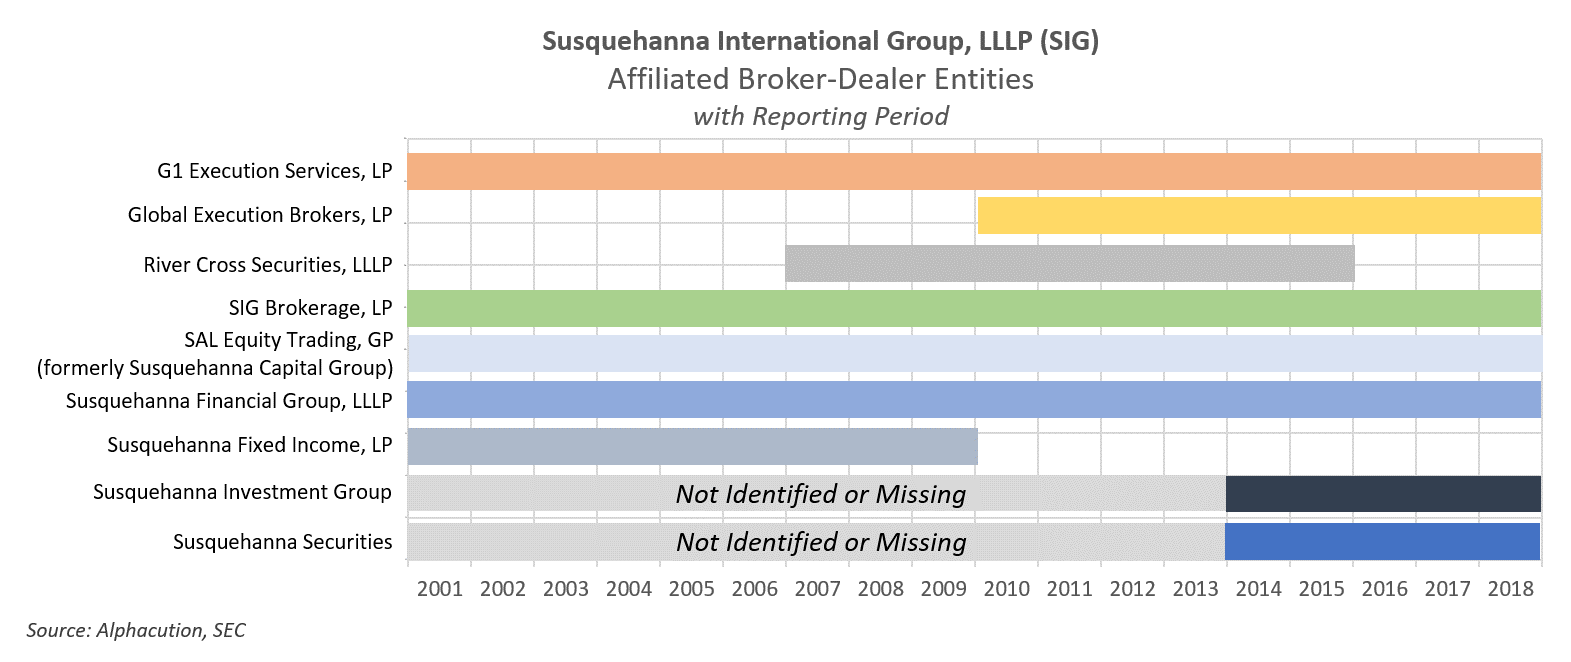
Here, two highlights need to be pointed out, for now: First, some entities are ramped up or wound down within the full range of the 18 years since Form X-17-A5 first started to be filed. For complex trading firms, this is common. Plus, for this case study, we will not focus on these short-lived entities because, to date, none of them are consequential enough to the overall risk-taking of the company’s trading operations.
Second, we need to point out that several annual filings for the broker-dealers, Susquehanna Investment Group (not to be confused with the main entity, Susquehanna International Group, LLP) and the main market making entity, Susquehanna Securities, are believed to exist but either have not been filed or we could not find them. (They were not located where the other reports were stored.) So, not only does this impact and impede the most comprehensive analysis that Alphacution could perform, it potentially deprives others of performing their own analysis. That said, the fact that they appear to be missing after so long implies how rare it is for someone to perform an analysis similar to Alphacution’s.
Now, Alphacution has identified other cases, with other trading firms, where reports are missing (usually involving Form X-17-A5) or position-level mistakes are made (usually involving Form 13F-HR; the “holdings report”). Such apparent errors are relatively common. Even though the 13F reporting requirements are highly standardized, it’s fascinating to note how different each firms’ filings can be. In one instance so far, one trading firm (Jump Trading) has gone back to file an amended 13F-HR report (i.e. – Form 13F-HR/A) – nearly five years after the original 13F filing – prompted exclusively by an Alphacution analysis and posting to our Feed. Perhaps the mystery of the missing SIG data – which, as you will see later, likely includes 13F data, as well – will be solved in similar fashion.
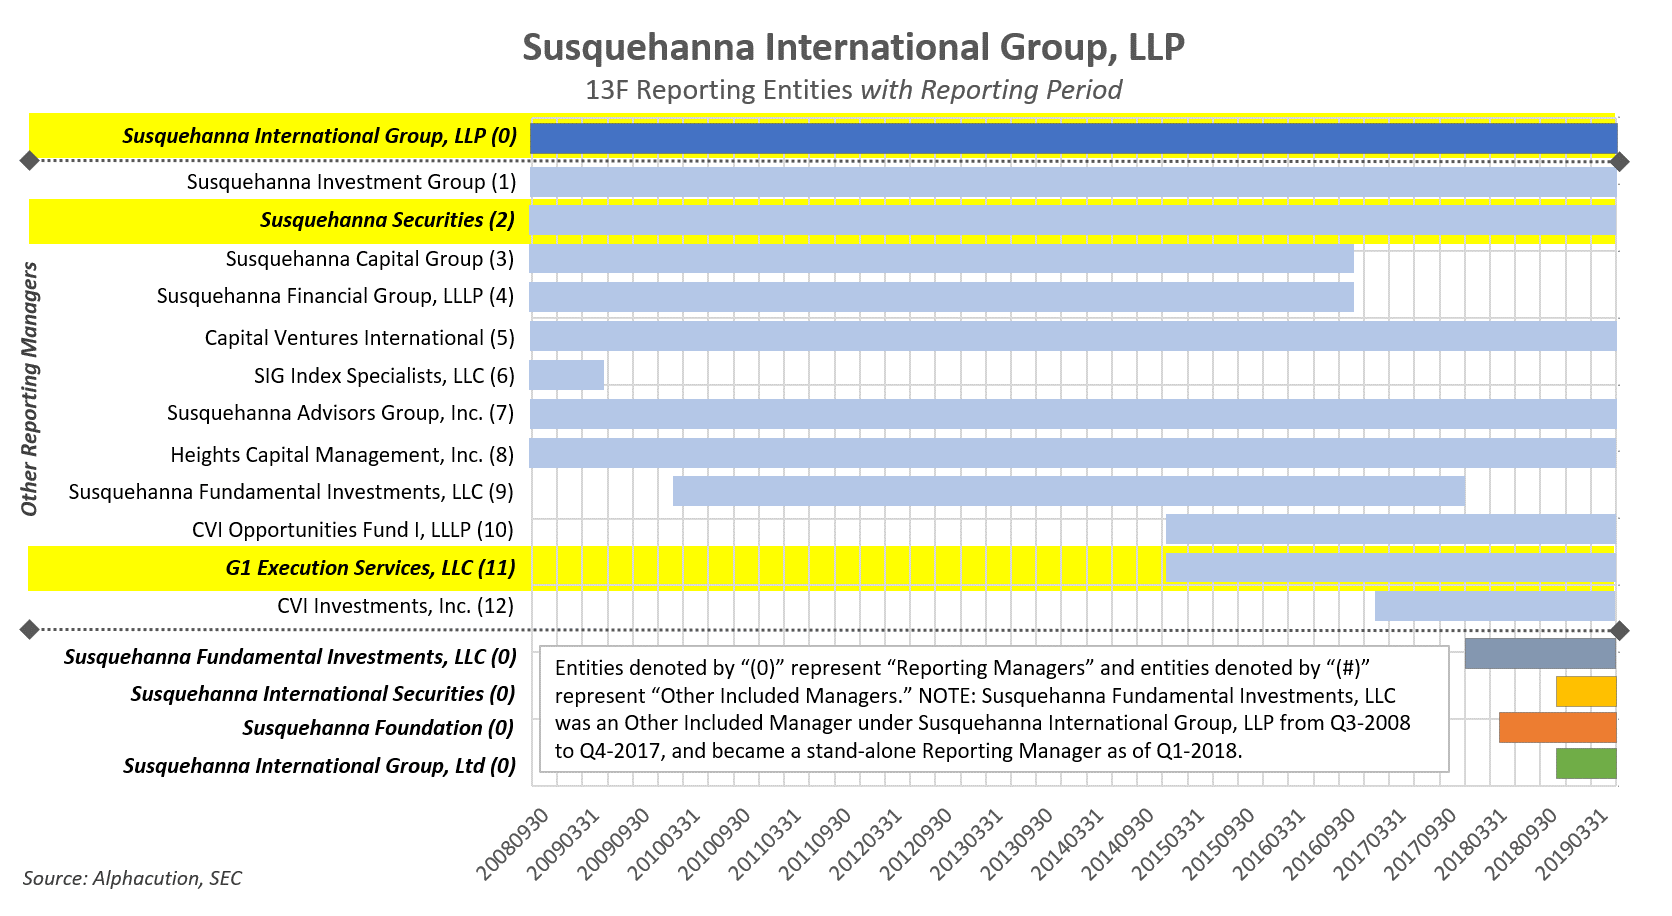
Speaking of 13F reports, the next part of the SIG structural overview involves showcasing all the entities that are reporting positions via Form 13F. In Exhibit 2, below, Alphacution identifies 16 distinct entities – 5 of which as the main holding reporting entities, officially known as “Reporting Managers,” and 11 of which known as “Other Included Managers”[1] – that have submitted 13F reports over the currently available[2] 43-quarter range to date, beginning Q3 2008 and ending Q1 2019.
Like the broker-dealer affiliate reports, Alphacution will not be focusing on all 13F reporting entities for this case study. In fact, we will only be focusing on three position-reporting entities here: the main reporting manager, Susquehanna International Group, LLP, and the two most consequential “other included managers,” Susquehanna Securities and G1 Execution Services, LLC. The reason for this focus can be found clearly illustrated in Exhibit 3, below. For the years 2014 – 2018 (and estimated for the years 2010 – 2013), Susquehanna Securities has represented, on average, 92% of the gross fair market value[3] for a summation of all broker-dealer entities over the period. And, for 2018, with the addition of G1’s growing exposures, the duo represented 96.9% of gross fair market values.
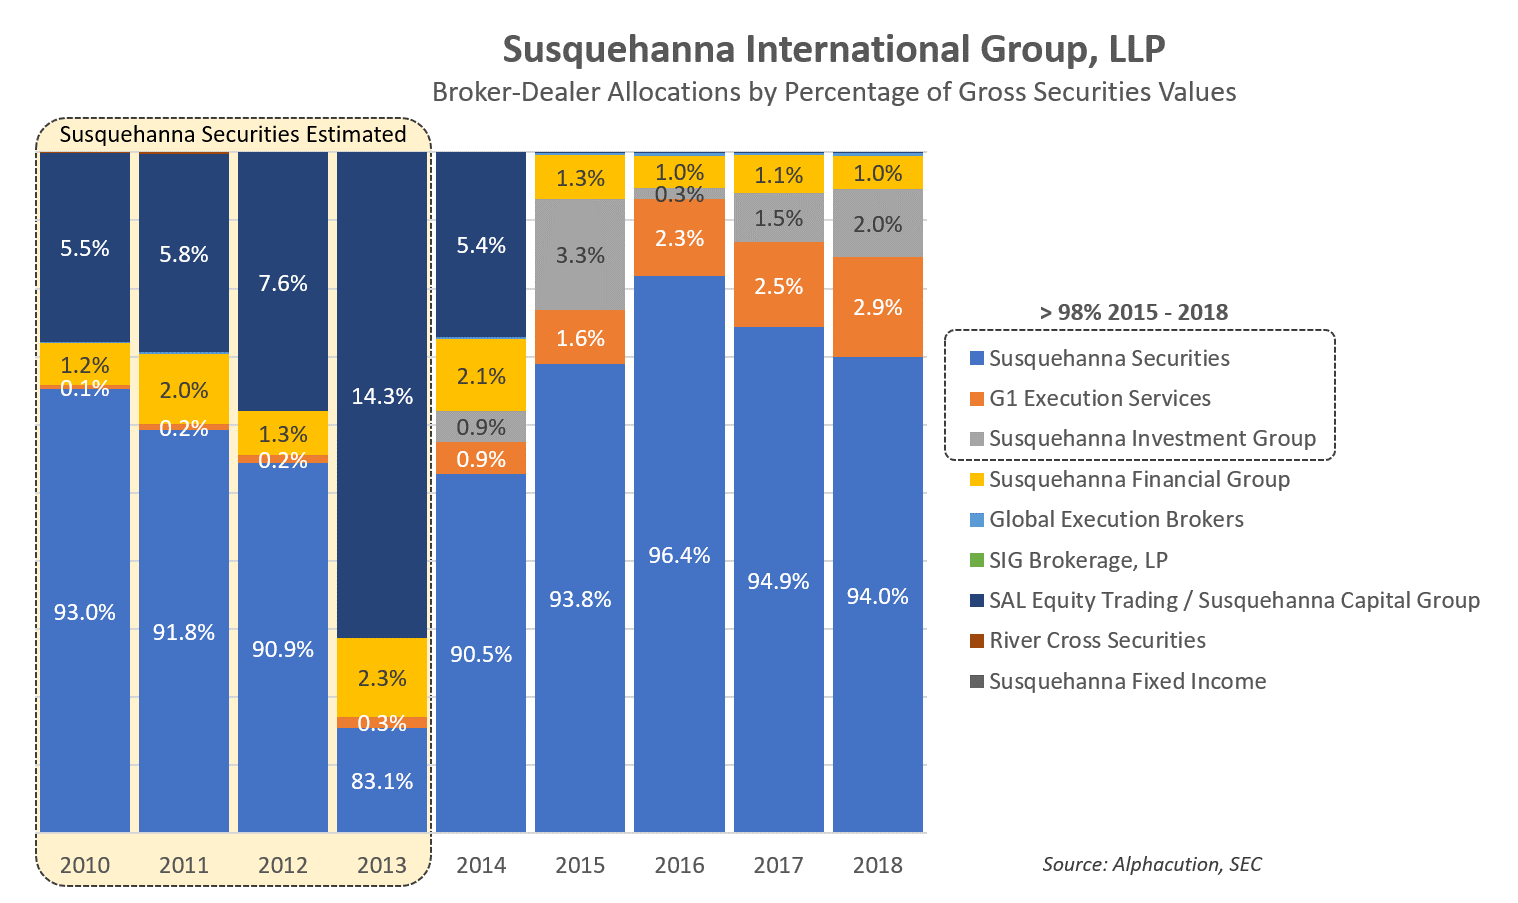
In other words, wherever Susquehanna Securities goes, this evidence implies, so goes SIG. Therefore, it is here among the details of Susquehanna Securities – along with some interesting data accumulating at G1 – that we will focus our story…
Contextual Overview
There are a few more concepts that we want you to be thinking about before we get into the strategy details:
This is the third in our series of case studies where we are taking time to focus mainly on the business and trading strategies of market makers, proprietary trading firms, and quant-focused hedge funds. (The subjects of the first two case studies were Spot Trading, the Chicago-based proprietary options trading firm, and Citadel Securities, the Chicago-headquartered equity, ETF and options market making firm – and affiliate of the Citadel hedge fund operation.)
There is a reason that Alphacution is currently focusing its modeling efforts primarily – albeit, not exclusively – on those firms that operate in closest proximity to the sources of liquidity. The logic goes like this: Based on its unprecedented and unparalleled research on technology spending patterns in trading and asset management and the subset of those firms that successfully compete by wielding technology, Alphacution believes that the entire asset management ecosystem – of which market making and proprietary trading are a unique part – is being bifurcated between alpha investment vehicles and beta investment vehicles. Alphacution’s research has further highlighted the concept that alpha – or, outperformance – has finite capacity. This means that there is a limited amount of capital upon which an excess rate of return can be earned. Furthermore, beyond the capacity level of capital to capture alpha, rates of return will decline until they reach the market rate of return – or, beta.
So, if the capacity of outperformance is finite and those who wield “industrialized” technical capabilities are best positioned to harvest that capacity, then we want to understand who these tech-wielding players are and try to quantify how much “alpha capacity” they are capturing. Most importantly, our concern is that a vast majority of the capacity of alpha is at risk of being “privatized” within leading market making, prop and hedge fund firms, thereby leaving only beta, beta-surrogates, and alpha-imposters accessible by the rest of us.
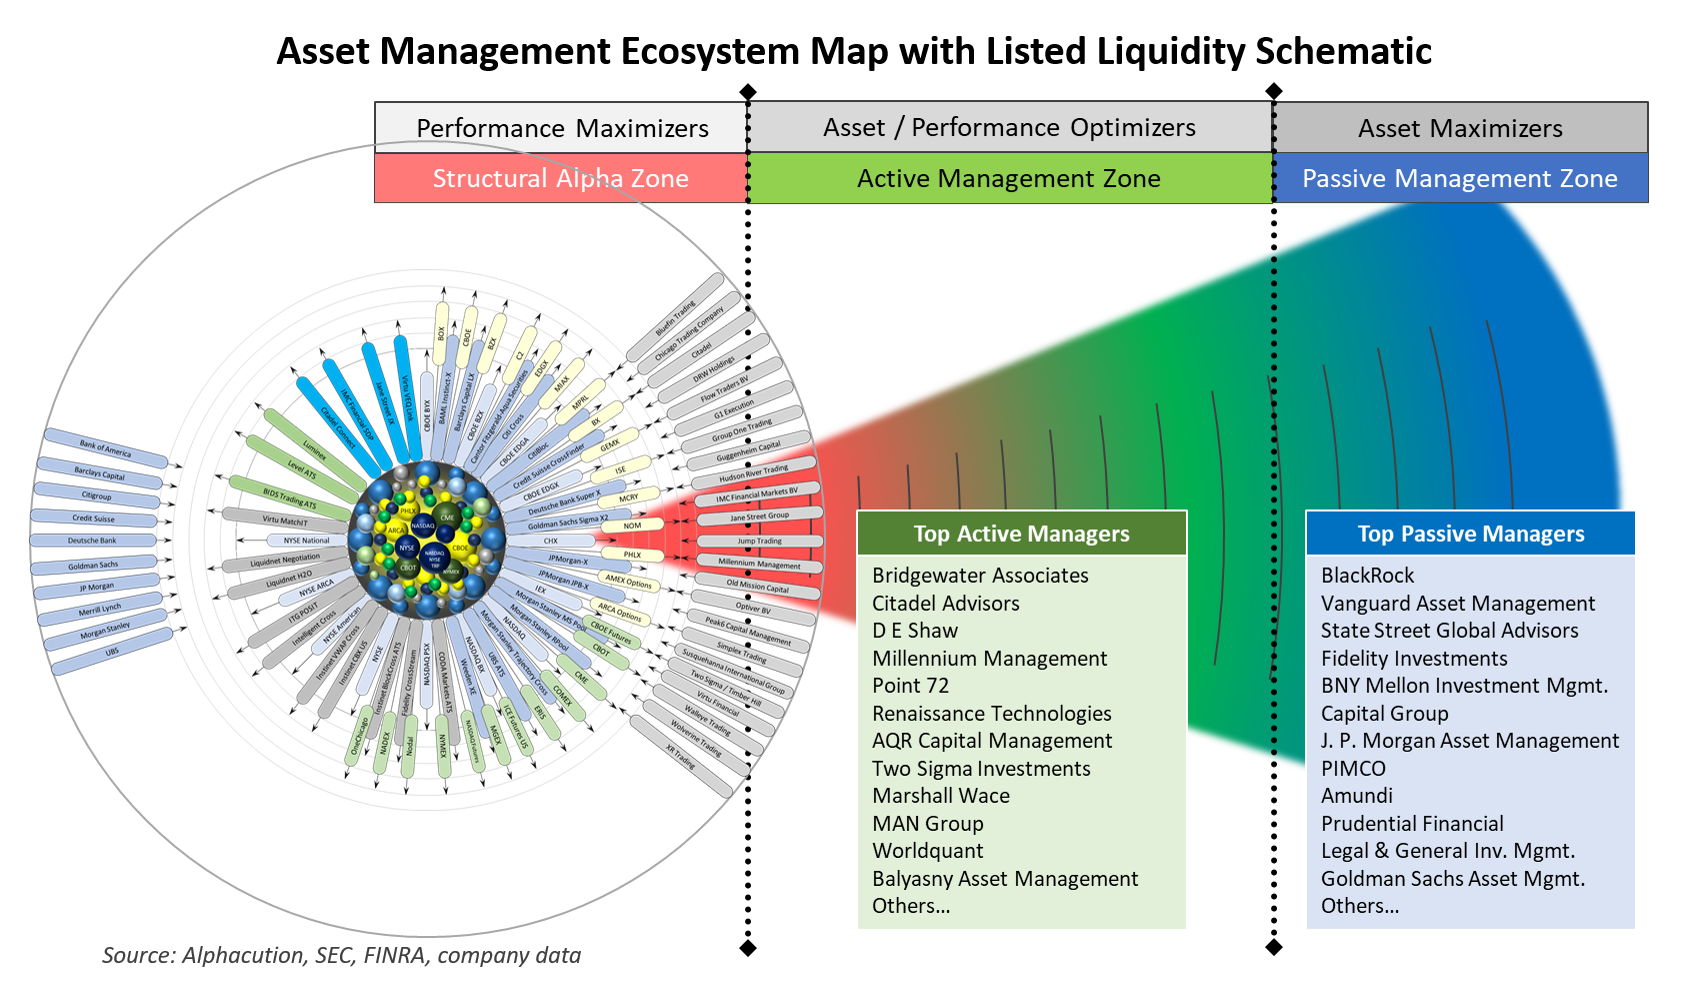
Showcasing this hypothesis and related market ecosystem dynamics is the goal of Alphacution’s current series of case studies. In Exhibit 4, below, Alphacution presents its initial list of the top 100 players in US listed markets (first published in February 2019). We will draw the subjects of upcoming case studies from this list.
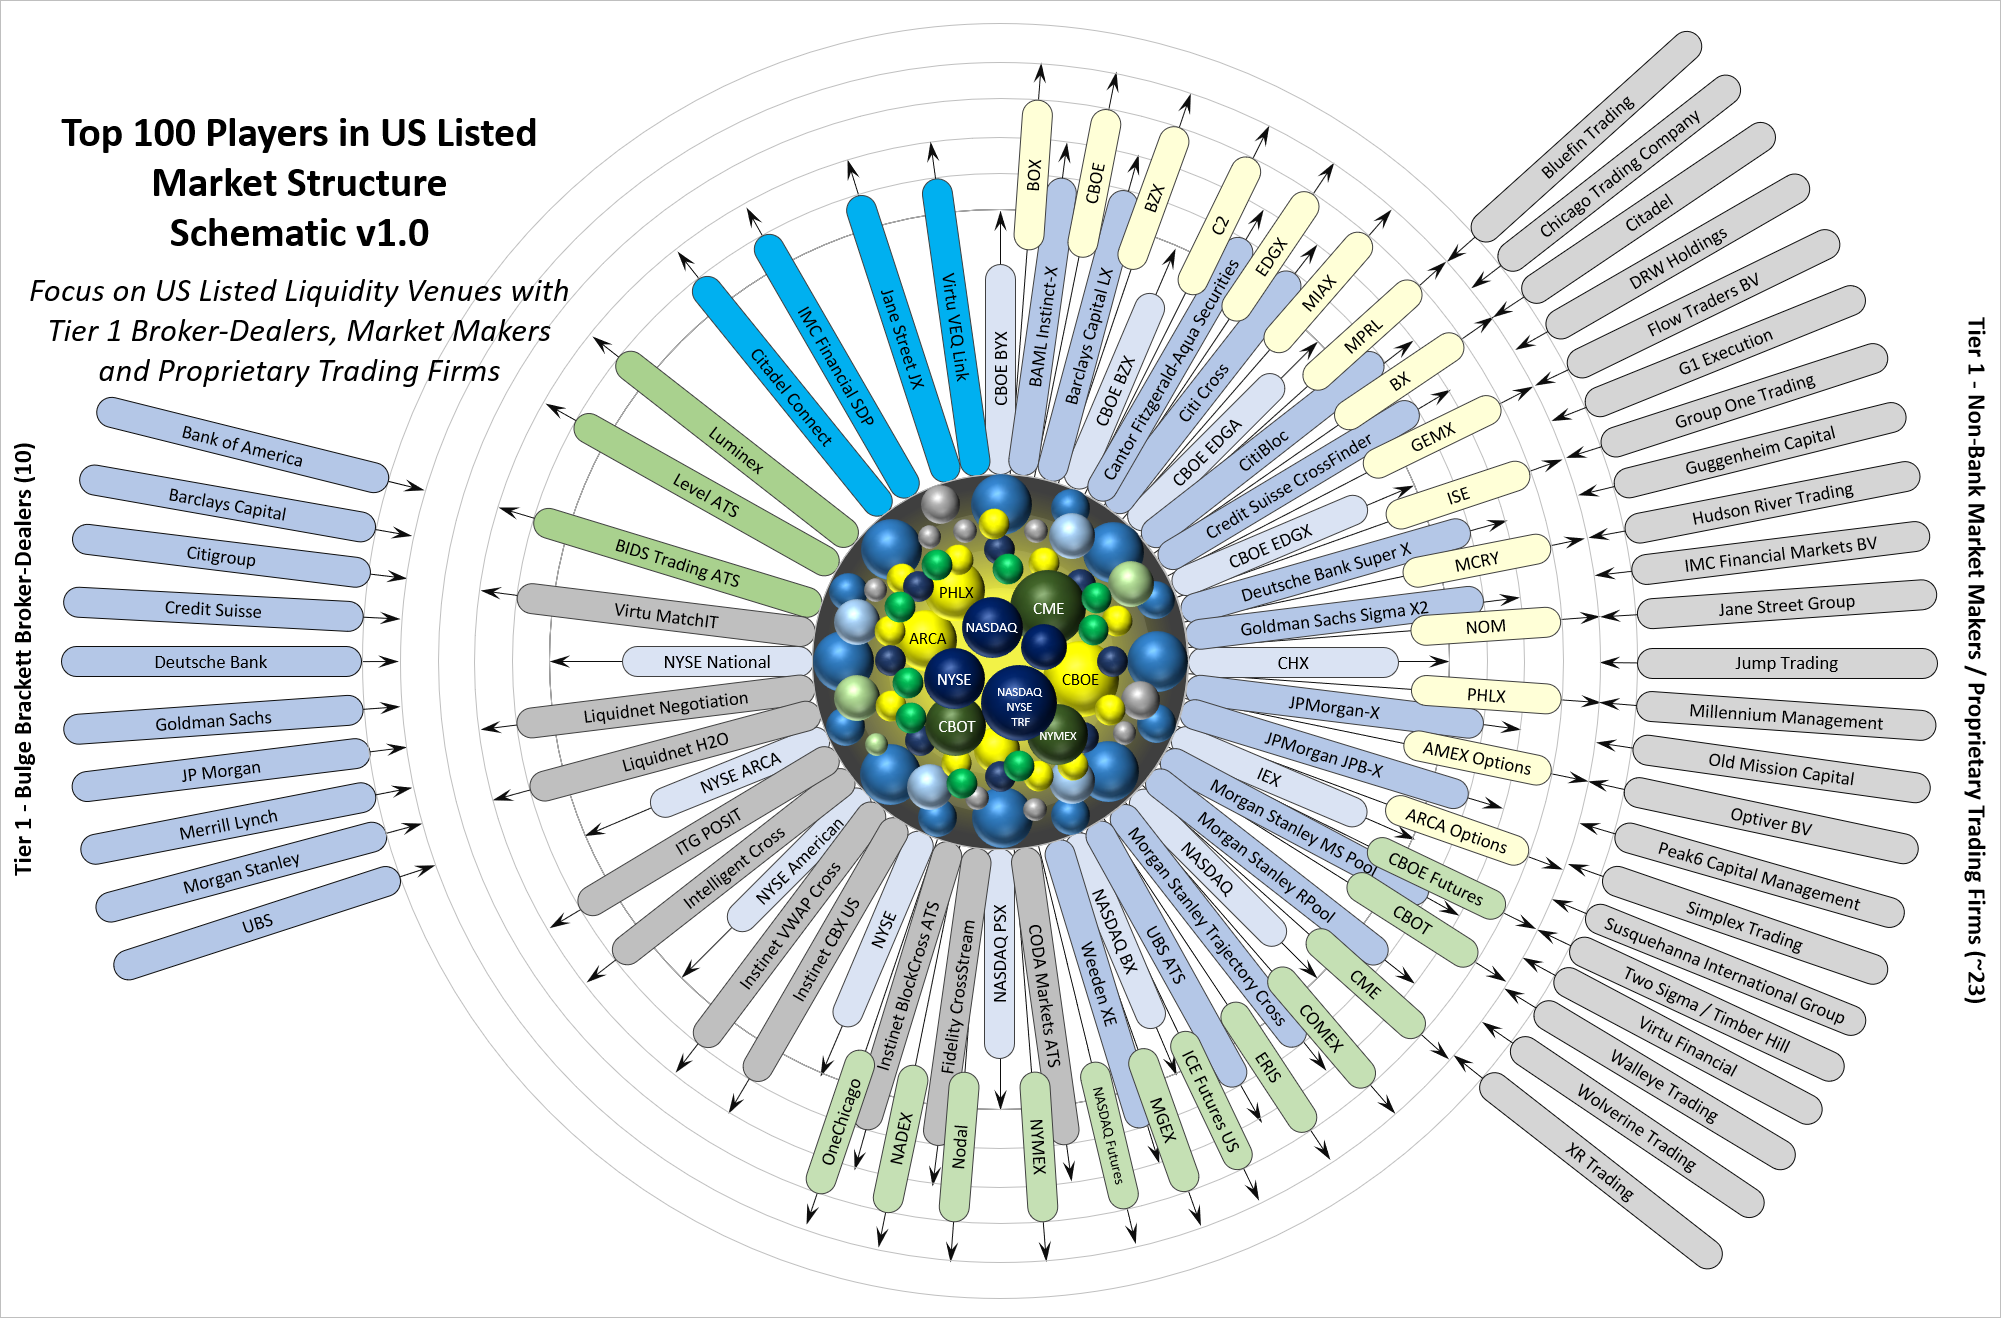
This community of market makers and proprietary trading firms are otherwise known as Alphacution’s structural alpha zone. These are the “performance maximizers” that deploy the most sophisticated technology on the least amount capital to harvest the greatest risk-adjusted returns. They operate on a comprehensive continuum of trading and investment strategies, largely based on average strategy turnover frequency (or, average position holding duration), that is segmented into three zones.
In time, Alphacution will refine this list by ranking the players based on its modeling of empirical evidence. That exercise is ongoing. However, in the interim, our structural alpha zone target list is comprised entirely of trading firms that simultaneously disclose certain holdings via 13F reports and are registered as broker-dealers. This factor helps us harvest greater insights from the available data. Moreover, the most fascinating subset of this target list 1) represent components of broader multi-strategy trading platforms, like Citadel Securities and Citadel Advisors or Two Sigma Securities and Two Sigma Investments, and/or 2) are making markets across multiple product classes, like cash, derivatives and/or structured products (namely, ETFs). Because it is here – among those who are proficient in options trading – our experience tells us that both technical and computational leadership is most likely to occur.
Adjacent to the structural alpha zone is the active management zone where a vast majority of hedge funds deploying various relative-value strategies and seeking a balance of asset level and performance reside. As AUM increases beyond the capacities of relative-value strategies, we arrive at the passive management zone where most traditional asset managers and a few massive ETF issuers reside. Exhibit 5 is Alphacution’s visualization of the three zones that make up its asset management ecosystem map with a (subjective) selection of top managers for each zone.
Now, with all this painstaking setup serving as stage and backdrop, we are just about ready to head into the details on SIG, Susquehanna Securities, and G1 Execution Services. However, one last contextual exercise we need to perform before we go there: Of all the firms Alphacution has modeled to date, SIG is unique based on its reported 13F gross notional market values. With few points of exception, SIG is greater on this analytic than other trading firm, so far. See Exhibit 6, below:
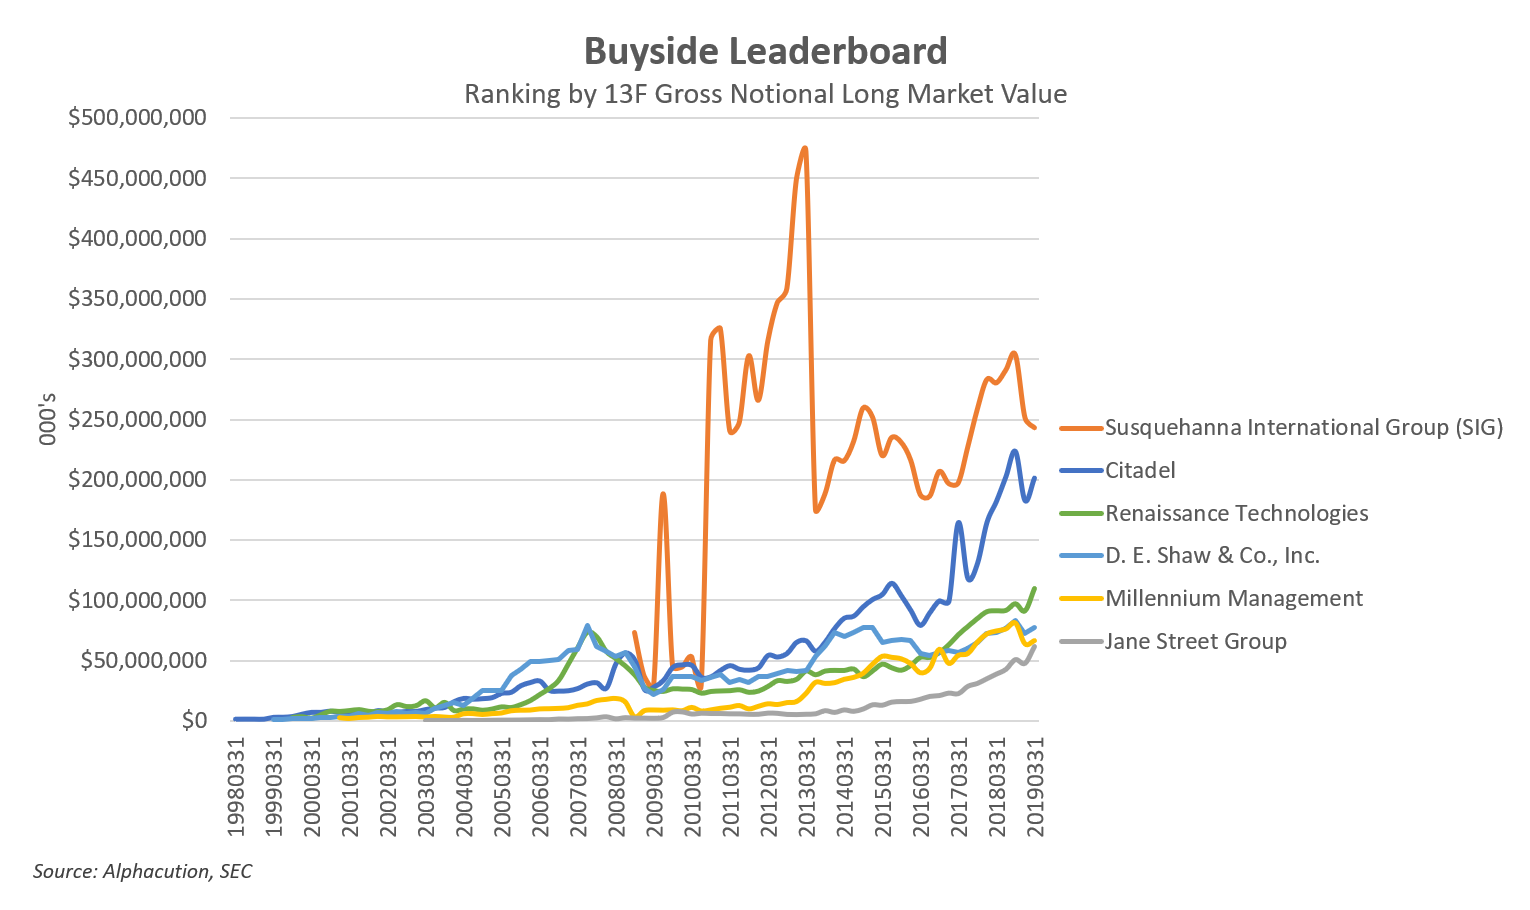
This ranking is precisely due to the high concentration of long option positions in SIG’s portfolio relative to most of the other players shown in this exhibit, particularly during its peak of nearly $473 billion for Q1 2013. Readers of this and other Alphacution analyses need to remember that this type of value divergence is an illusion caused by the 13F rules for option reporting. Option positions are reported as if they had already been exercised and converted into the underlying product. Another way to think of this is that option positions are reported at their 100-delta notional value and not at their actual delta fair market value. Keep this in mind as you review the material below. We will continue to point it out whenever relevant.
Data Sample
The storyboards and select findings contained in this report represent Alphacution’s interpretation of Susquehanna International Group’s and certain affiliated entities’ trading and, by implication, business strategies. The supporting data sample is comprised of the following:
- 43 quarterly 13F[1] holdings reports (including 13F-HR/A amendment reports) for the nearly 11-year time range beginning September 30, 2008 (or, Q3 2008) and ending March 31, 2019 (or, Q1 2019) by the Susquehanna International Group, LLP (SIG) lineage of reporting entities;
- 18 years of FOCUS reports (on Forms X-17-A5 and X-17-A5/A) for the years ending December 31, 2001 thru December 31, 2018 filed by 9 entities with the SEC, FINRA and SIPC. Of particular interest for this case study is the reporting by Susquehanna Securities and G1 Execution Services, LLC.
- 6 full account reports disclosing financial and operational data for the years ending December 31, 2010 thru December 31, 2011 and December 31, 2014 thru December 31, 2017 filed by Susquehanna International Securities Limited with the United Kingdom’s registrar of companies, Companies House;
- Contextual modeling, exhibits, case studies, Feed posts and/or any other pre-existing content from Alphacution’s research library focusing on the evolutionary impacts of technology on global financial markets and the trading, asset management, and banking businesses they serve; and,
- Any other peripheral data or content referenced in this report that was searchable on the surface internet.
No representative of Alphacution has spoken to any representative of SIG or affiliated entities for the preparation of this report. This report is solely based on the author’s interpretation of Alphacution’s ongoing assembly of raw data, contextualized modeling, and internally developed content.
Now.
Finally.
On to the detailed analysis…
Footnotes
[1] For each position record within each holdings report there is a “manager ID” field attributable to reporting manager or other included manager. The number after each manager in Exhibit 2 and others signify that manager ID.
[2] Alphacution finds it curious that a firm founded in 1987; one that we can assume enjoyed significant financial success throughout its history, would not file its first 13F reports until Q3 2008, more than 20 years after inception.
[3] Long side + short side
[4] Form 13F is a quarterly report filed, per United States Securities and Exchange Commission regulations, by “institutional investment managers” to the SEC and containing all position-level equity assets under management of at least $100 million in value with relevant long US holdings. All US-listed equity securities (including ETFs, equity options, and convertible bonds) in the manager’s portfolio are included and detailed according to the issuer name, security description, the security identifier (i.e. – CUSIP number), position value, number of shares, and other attributions.
As of March 31, 2019, Alphacution estimates that the full list of Form 13F securities count totals 17,707 securities. Short positions are not required to be disclosed and are not reported. Form 13F covers institutional investment managers, which include registered investment advisers (RIAs), banks, insurance companies, hedge funds, trust companies, pension funds, mutual funds, among other natural persons or entities with investment discretion over its own account or another’s. Form 13F is required to be filed within 45 days of the end of a calendar quarter. Find more about the 13F dataset on the Alphacution Feed.