
Patterns…
Preferably, persistent and predictable patterns…
It could be said that history is influenced by a series of pattern discoveries whereby new patterns are discovered with new tools, new technologies or new methodologies. Discovery always starts with variance of perspective, like a new pair of eyes. And, that kind of trick never gets old – even during an era of hyper-intensive innovation.
So, with that bit of philosophy as our backdrop, we arrive at today’s lesson: Alphacution discovered a persistent relationship between assets and headcount for asset managers, which led to new insights about strategy selections, technology spending, and workflow automation among a broad community of asset managers, hedge funds and others. This analysis was presented in its initial asset manager technology spending study, the Context Machine (April 2018).
Upon further analysis, it turns out that there is also a persistent relationship between assets and headcount for asset servicers, like custodians and administrators. The significance of this discovery represents the beginnings of our ability to benchmark asset servicing costs and workflow efficiencies, as well as quantify incremental operational risks among custodian banks and other asset servicers.
Based on modeling of @StateStreet, @BNYMellon, @NorthernTrust, and @JPMorgan Chase, here are some numbers and pictures to support this claim:
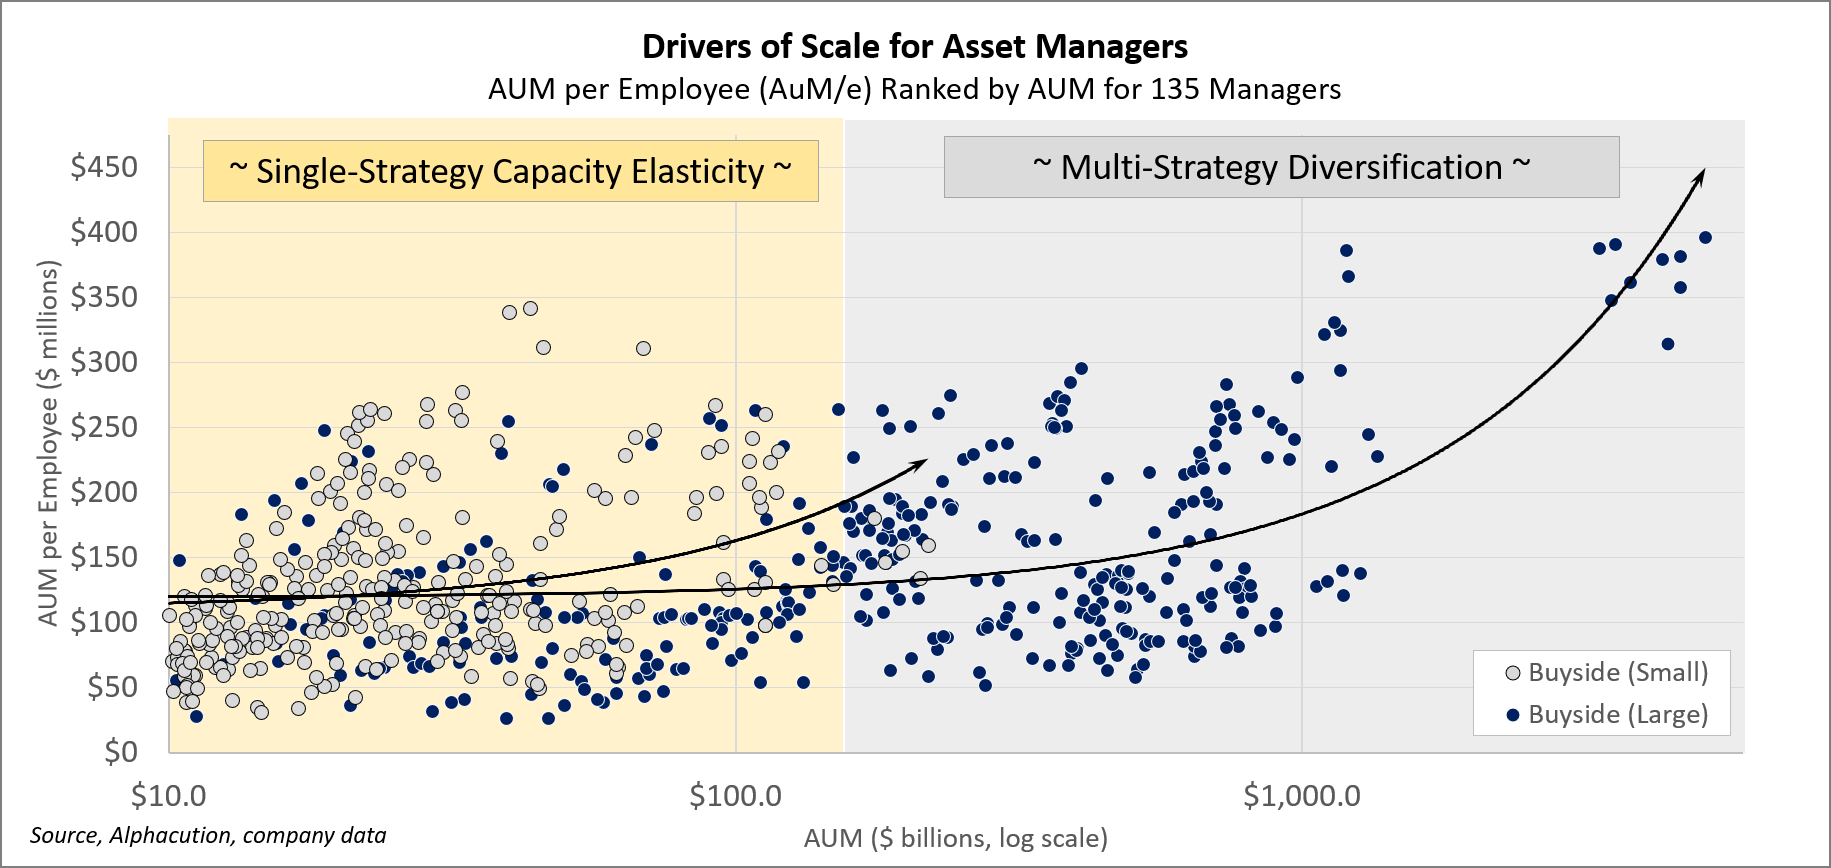
In pursuit of measuring and modeling the impact of technology strategies on business performance specifically for asset managers, Alphacution learned to ask a different question, “How do asset managers scale?” This question is essentially asking about the relationship between assets under management (AUM) and headcount (e) as AUM changes. The analysis of the ratio of AUM to headcount – AUM/e – led to a fascinating discovery about the persistent relationship between headcount, investment strategy selection, technology spending and workflow automation (also sometimes known as technical leverage).
Here’s a picture of this phenomenon for 135 asset managers between 2005 and 2016 (where average AUM/e tends to be roughly $125 million per employee for managers with AUM > $10 billion):
As we develop our second major study on asset manager technology spending, these types of patterns will prove to be increasingly informative.
Now, when we apply this type of analysis to a comparison of the cost of post-trade processing – using the ratio of assets under custody (AUC) per employee (e) – similar types of patterns emerge. Given our initial sample of four of the largest custodian banks, the benchmark figure for AUC/e was about $890 million for 2017 with a range of $767 to $931 million:
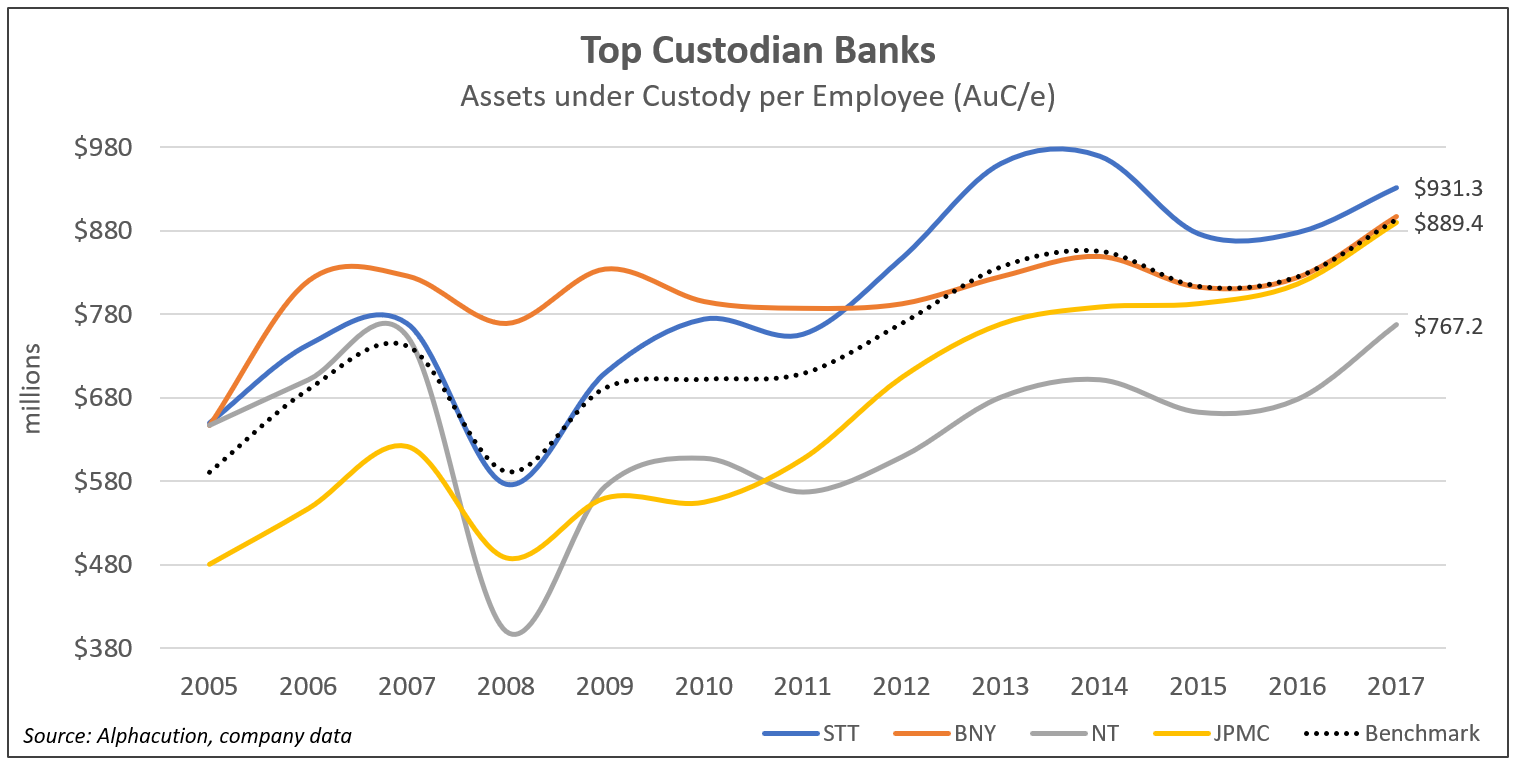
This simple illustration tells a vivid story. Though these custodians operate similar workflows, use similar tools and methods, and operate with similar cost structures, the data shows that STT has been the most efficient (with the highest AUC/e of $931.3 million in 2017) and NT the least efficient of the group (with the lowest AUC/e of $767.2 million in 2017) for the past few years. However, these facts may not always be the most important, since the AUC/e for BNY has been the least volatile, even through the treacherous Global Financial Crisis (GFC) period of 2008-2009. And, JPMC has improved the most over the analysis period, which may be an indication of their ability to innovate relative to the group – and/or, their size has been equated with safety.
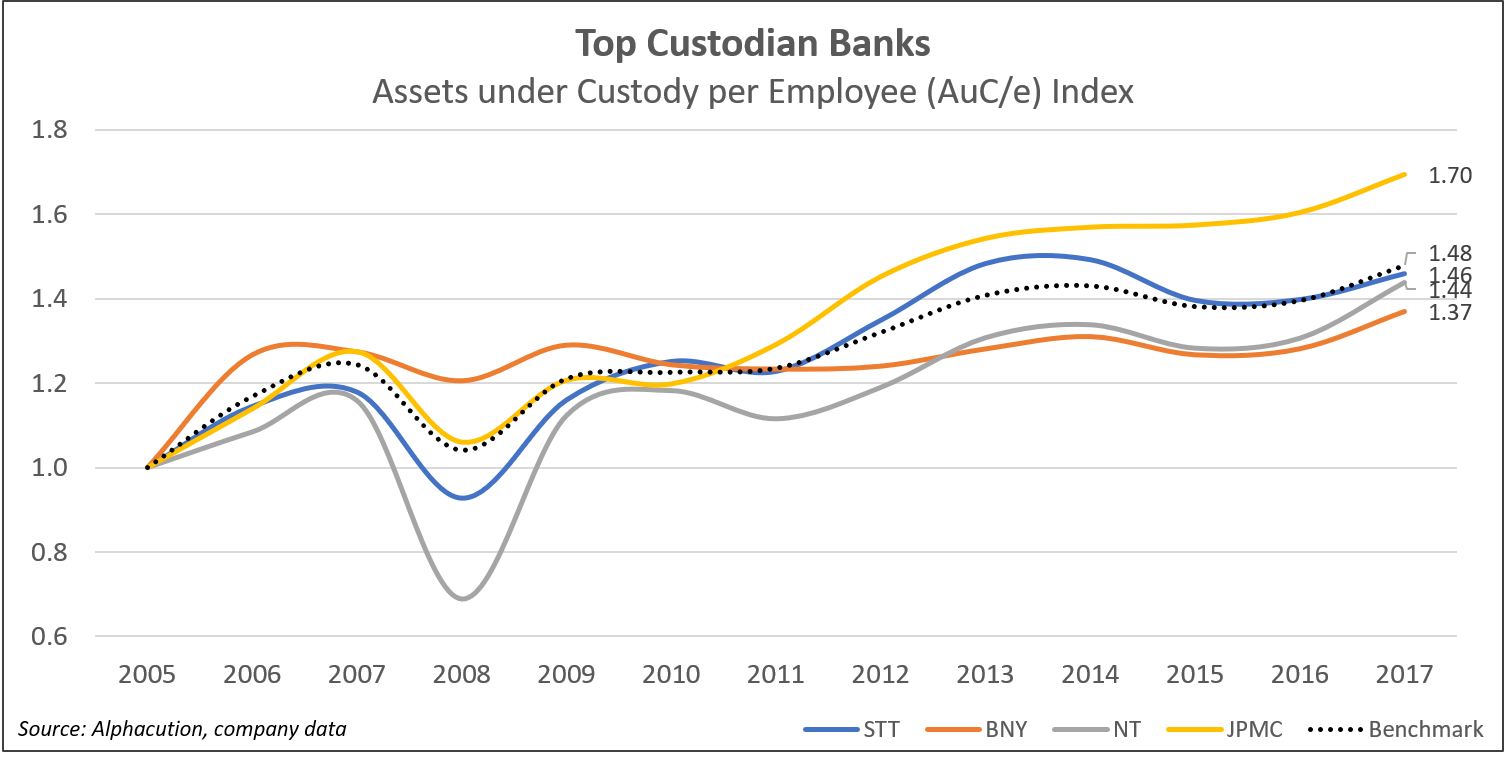
These highlights and others are supported by an alternative view of the analysis, which is an index of AUC/e since 2005:
Our conclusion:
AUC/e is a reliable first step in comparing the cost, workflow automation levels and incremental operational risks of asset custodians. With an expanded sample and more detailed data, this method could become an increasingly impactful source of intelligence for stakeholders in the global banking arena.
Stay tuned…
As always, if you value this work: Like it, share it, comment on it – or discuss amongst your colleagues – and then send us feedback@alphacution.com.
As our “feedback loop” becomes more vibrant – given input from clients and other members of our network, especially around new questions to be answered – the value of this work will accelerate.
Don’t be shy…