
The following is Part 2 in the series “#DigitalTransformation: Clues to Shifting FinTech” published on November 2, 2015.
Digital crumbs don’t discriminate. They illuminate everything. True to this, and despite intense focus on cloud-based offerings, infrastructure-as-a-service (IaaS) and other managed services solutions, the digital transformation in the financial services industry (FSI) is by no means confined to hardware. Software development in FSI is in the midst of its own revolution, as well. In either case, and by my my estimation, overall fintech is now entering its third year of “white-hotness.”
As a reminder, in Part 1 of this commentary, we highlighted growing evidence of the shift from capital expenditures (“capex”) to operating expenses (“opex”) for hardware and other infrastructure. In an upcoming post, we will dig a bit deeper into this theme by showcasing what the previously announced multi-billion dollar outsourcing deal between Deutsche Bank and Hewlett Packard (February 24, 2015) means for IaaS and other managed services adoption in FSI generally and for large global banks in specific – particularly now that many of the largest European banks, for instance, have telegraphed expectations for lackluster 2016 results.
We also mentioned in that first post that there is evidence for an inverse shift in opex to capex for software. The message here is that the digital transformation in FSI is not confined to infrastructure. There is an equally disruptive force occurring in software development. The following illustration is just one of many such examples we have modeled to show how unprecedented regulatory and competitive drivers are forcing large global banks – technically, global systemically important banks (G-SIBs) to allocate significant resources to customized application development (see Exhibit):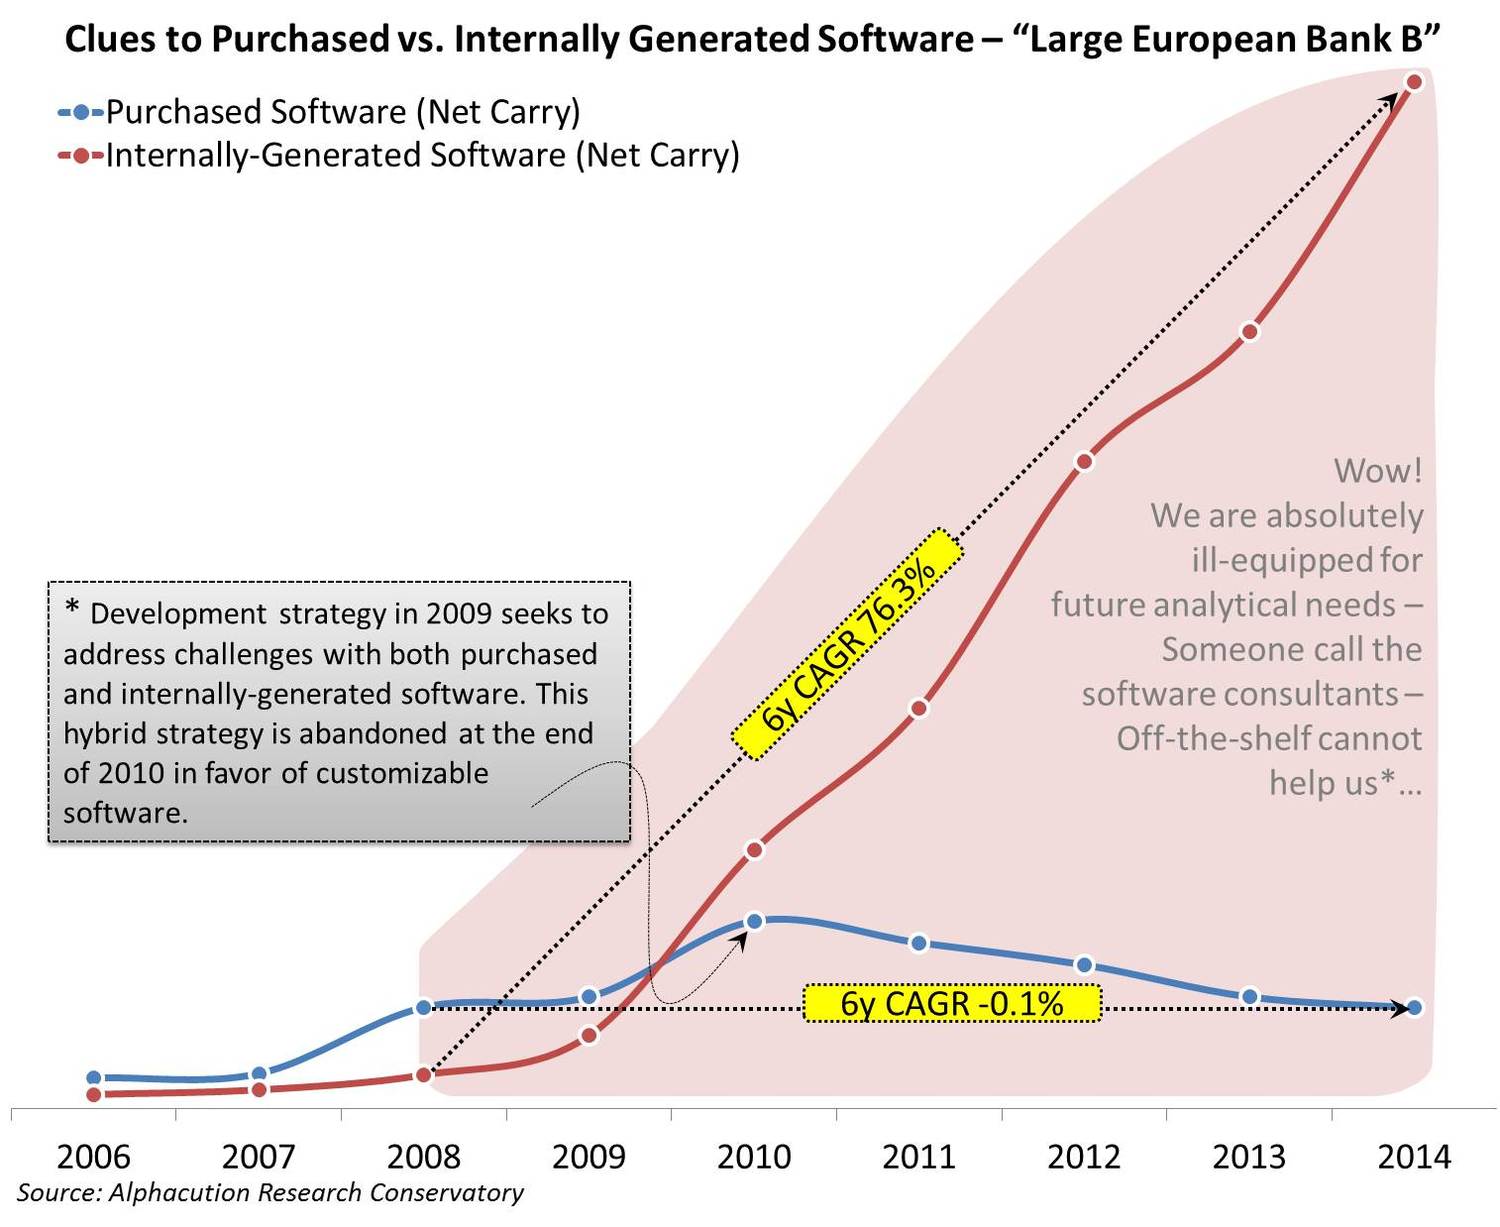
In this example, one of the largest European banks begins to ramp up investments in internally-generated software immediately after the eye of the global financial crisis (GFC) makes landfall in early 2009. And, by tracking the numbers, this bank never looks back after 2009, generating a face-melting growth in spending CAGR of 76.3% over the subsequent 6 years ending 2014. By the end of 2014, net carry value of internally-generated software is over US$ 3 billion. Meanwhile, there is an early attempt around the same time in 2009 to increase allocations to purchased software that is subsequently abandoned after 2010, generating a comparative CAGR of -0.1% over the same 6-year period ending 2014. By that time, the net carry value of purchased software stands at about 10% of the net carry value for internally-generated software.
What’s more illuminating than these numbers is that it doesn’t matter the identity of our “large European bank” in the chart above. While the numbers and trajectories shift, the themes are basically the same for the collection of European banks that we have analyzed at this level so far (about 10). Across the board, internally-generate software development investments have grown at an exceedingly rapid and unsustainable pace in the post-GFC period. (NOTE: premium subscribers to this content gain access to all the names, numbers, rankings and additional analysis.)
There are other important narratives embedded in these findings, as well: First, we interpret the significant ramp up in the net carry value of internally-generated software to be correlated with engagements of 3rd party development shops. Though not necessarily exclusive to agents, we don’t believe the trajectory of this ramp could be managed entirely on the back of waves of new full-time equivalents (FTEs) – particularly given that in most cases internally-generated software investments were at a very lower level in the pre-GFC era and because we believe most of this development is based on new functionality (as discussed below). Subsequent Alphacution modeling will seek to corroborate this hypothesis by looking at the other side of this proverbial ledger: What do the fortunes of large technology consulting firms – like Cognizant Technology Solutions (CTS), Infosys or Tata Consulting Services (TCS) among many others – over the same period suggest about the ongoing demand for custom software development?
The other finding from these figures that bears mentioning here is the signal it provides for packaged solution providers. On one hand, all of the demand for functionality is based on new drivers, mainly regulation in the wholesale arena (like collateral management, enterprise risk analytics, compliance, surveillance, reporting and a ton of redundancy-busting integration) and innovation in the retail arena (like mobility features and enhanced customer experience). It’s arguable that little to no amount of this demand could be satisfied off-the-shelf in 2009 or after. On the other hand, as is often the case, the large software solution providers in FSI have an opportunity to take ownership of these new solutions and capabilities as they mature.
As of the latest rankings from the Financial Stability Board (FSB) in November 2014, there are 22 G-SIBs. This month (November 2015) an updated G-SIBs list will be published. Once we have confirmation of the updated G-SIBs list, we will provide analytics around these technology spending patterns.