
“To develop a complete mind: Study the art of science; study the science of art. Learn how to see. Realize that everything connects to everything else” – Leonardo da Vinci
If there was ever a moment in time when we realized just how much everything connects to everything else – a quote (and concept) I have been using to repeatedly bludgeon you lo these many past months – now would be that moment. However, so as not to jump on the singularly overcrowded bandwagon of doom that is the current events flow of content (for now), I’d like to walk through a storyboard of related significance.
That sadly familiar aroma in the air is fear; a specific vintage of which has not washed over the market ecosystem since 2008. Many are coming to the conclusion that if the virus doesn’t take us down, the arsenal of preventative measures just might – and therefore, one way or another, we are likely entering a period of financial stress (to put it as mildly as I can – for now).
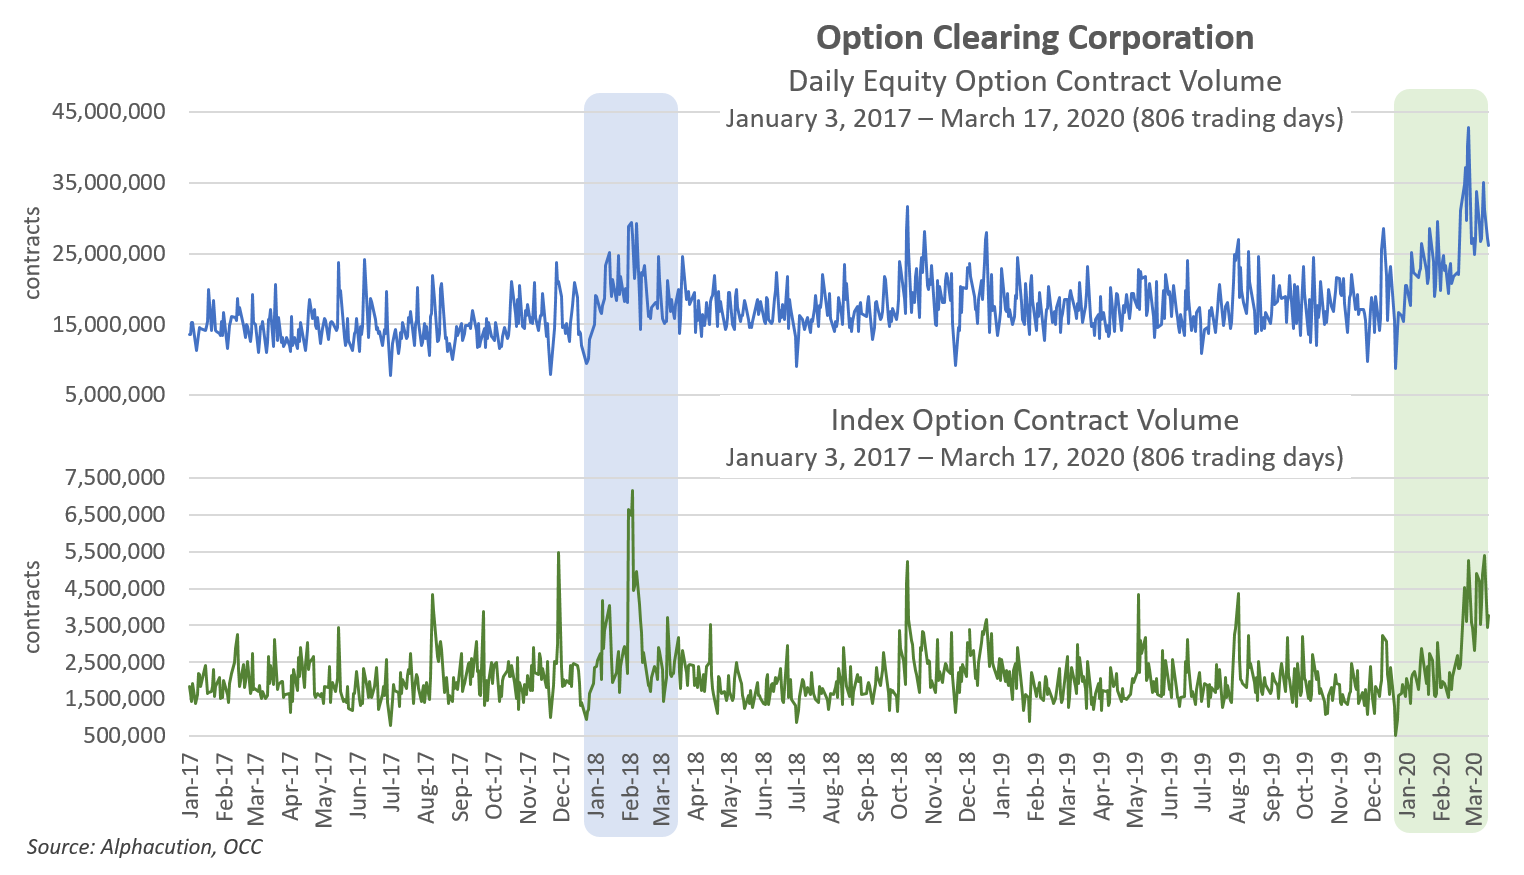
With that prelude as backdrop, I figured a visual look into the option market and volatility levels today relative to 2008 would prove a useful benchmarking exercise for our readers, starting here thanks to our friends at Option Clearing Corp. (OCC): In the chart, below, Alphacution presents 3,056 trading days (Jan 2, 2008 – Mar 17, 2020) of daily equity and index option contract volumes for all US options exchanges that covers the 2008-2009 Global Financial Crisis (GFC) and the emerging Coronavirus Pandemic (CVP).
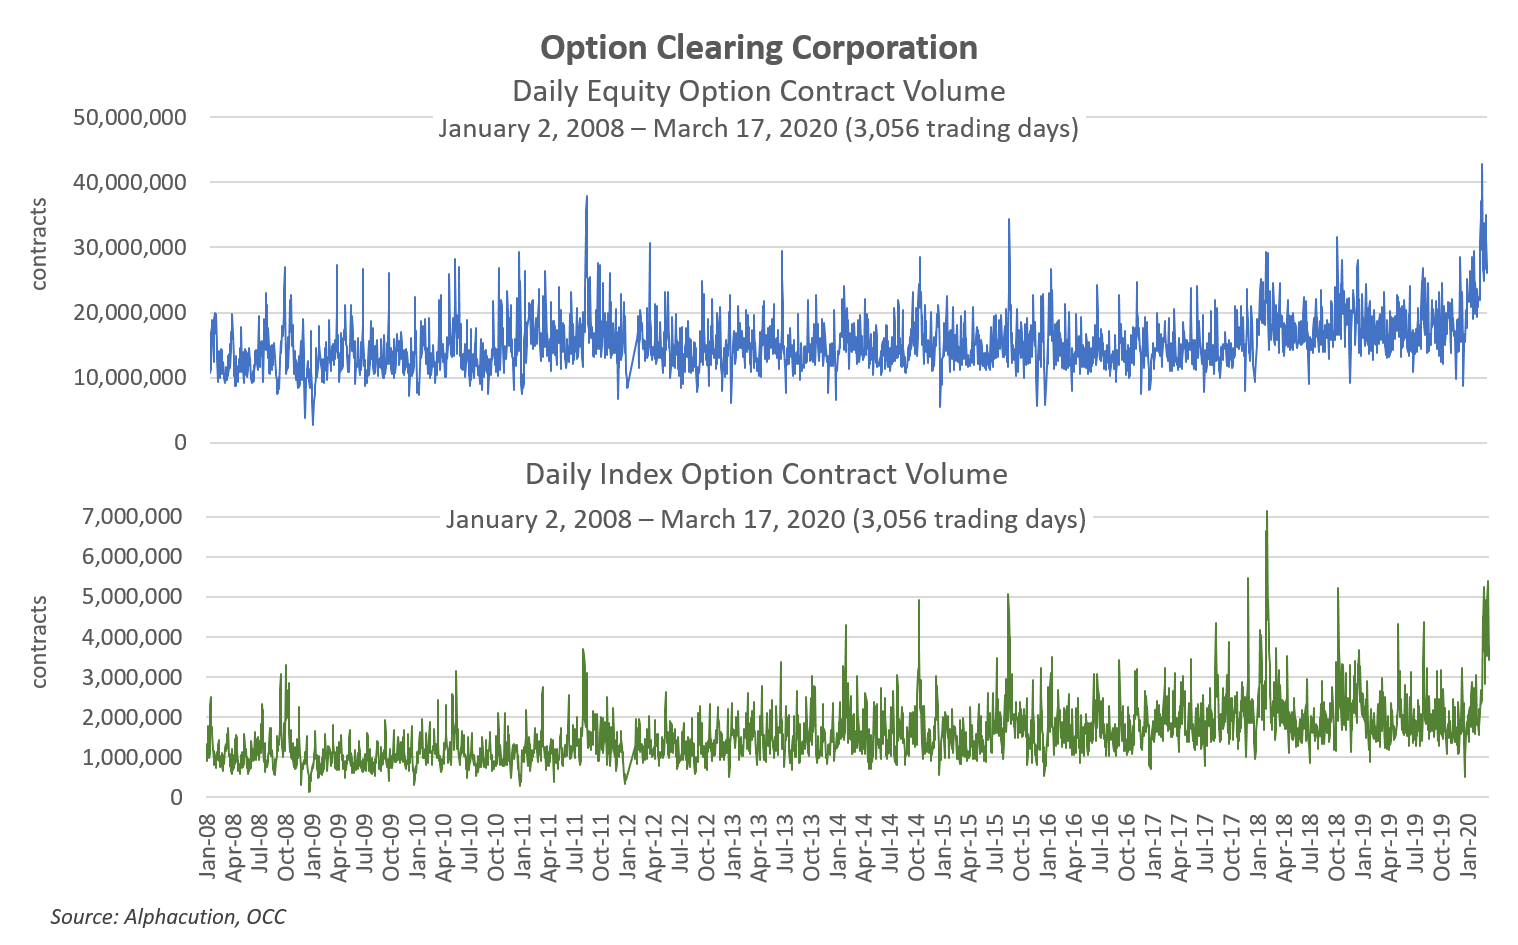
Here, the basic observation is that equity option volumes have achieved an unprecedented trend for the entire 12+ year period in the emerging CVP, while index option volumes (though spiking of late) have not moved into unchartered territory for the period. (Index option volume that corresponded with the volatility spike in early Feb 2018 still remains the all-time high for the period.)
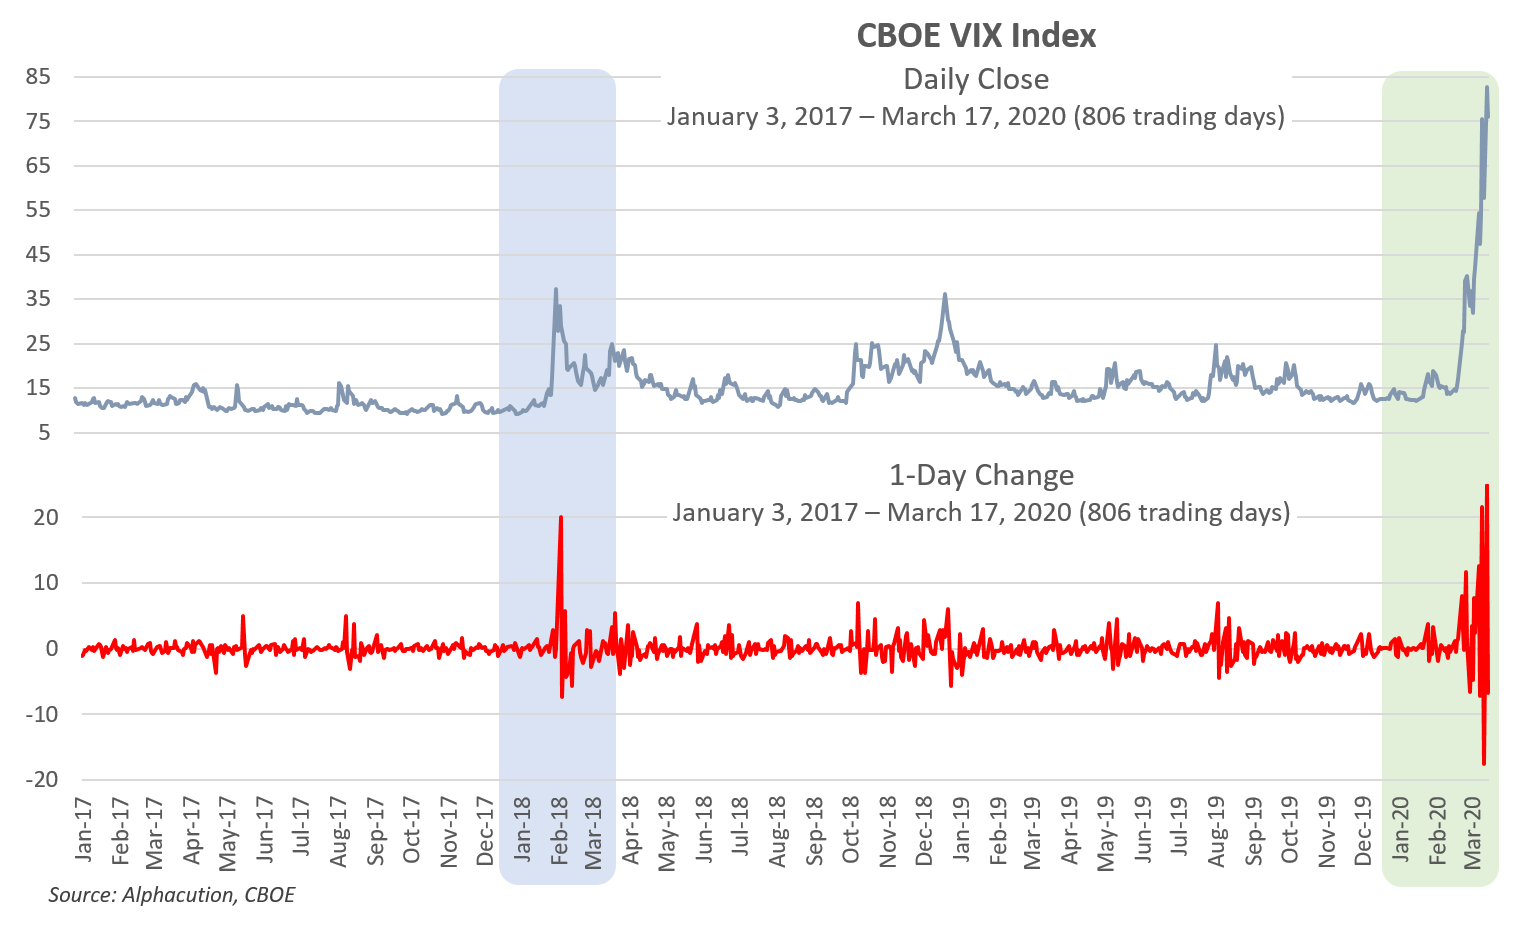
Now, of course, these volume trends are being driven by dramatic and unprecedented moves in cash equity markets, which is measured by the CBOE’s VIX Index. In the chart, below, Alphacution presents daily closes for the VIX for the same period as the OCC volume data. Here, it is clear that the market has entered GFC-like territory in terms of its “fear” reading; a shock to the ecosystem that lasted roughly 218 trading days between Sep 2008 and July 2009 and foreshadows that we are in for more turbulent-than-normal waters through year-end 2020.
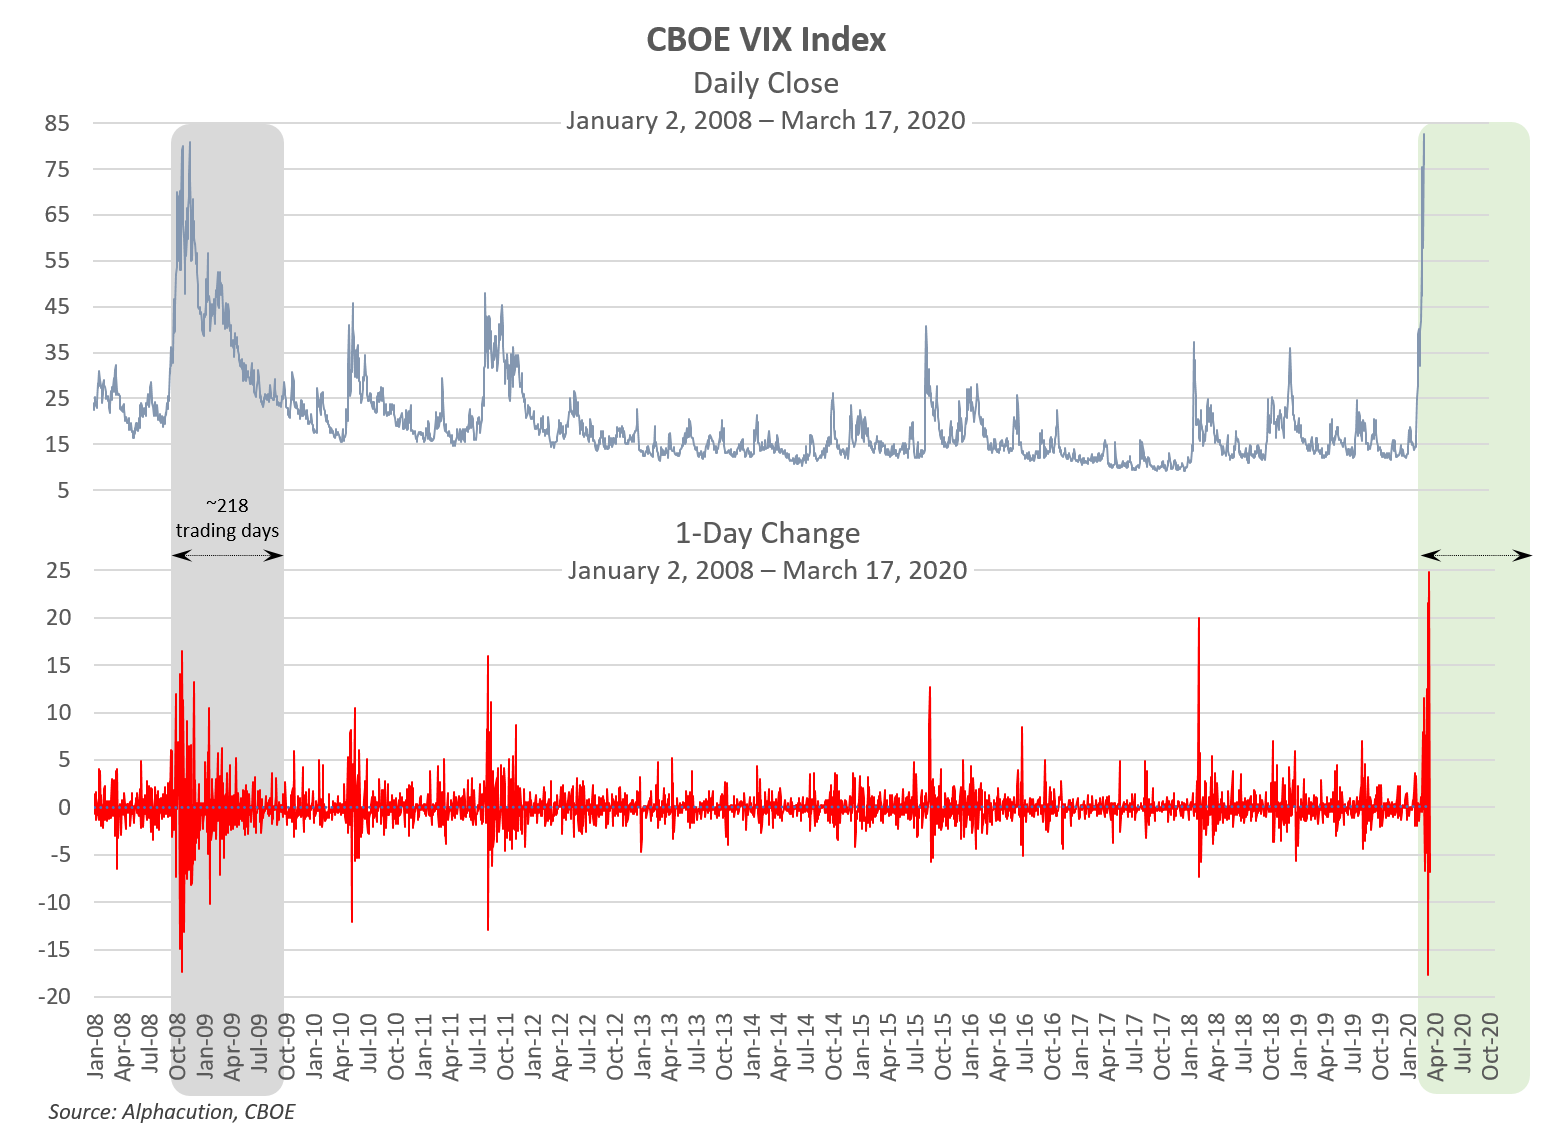
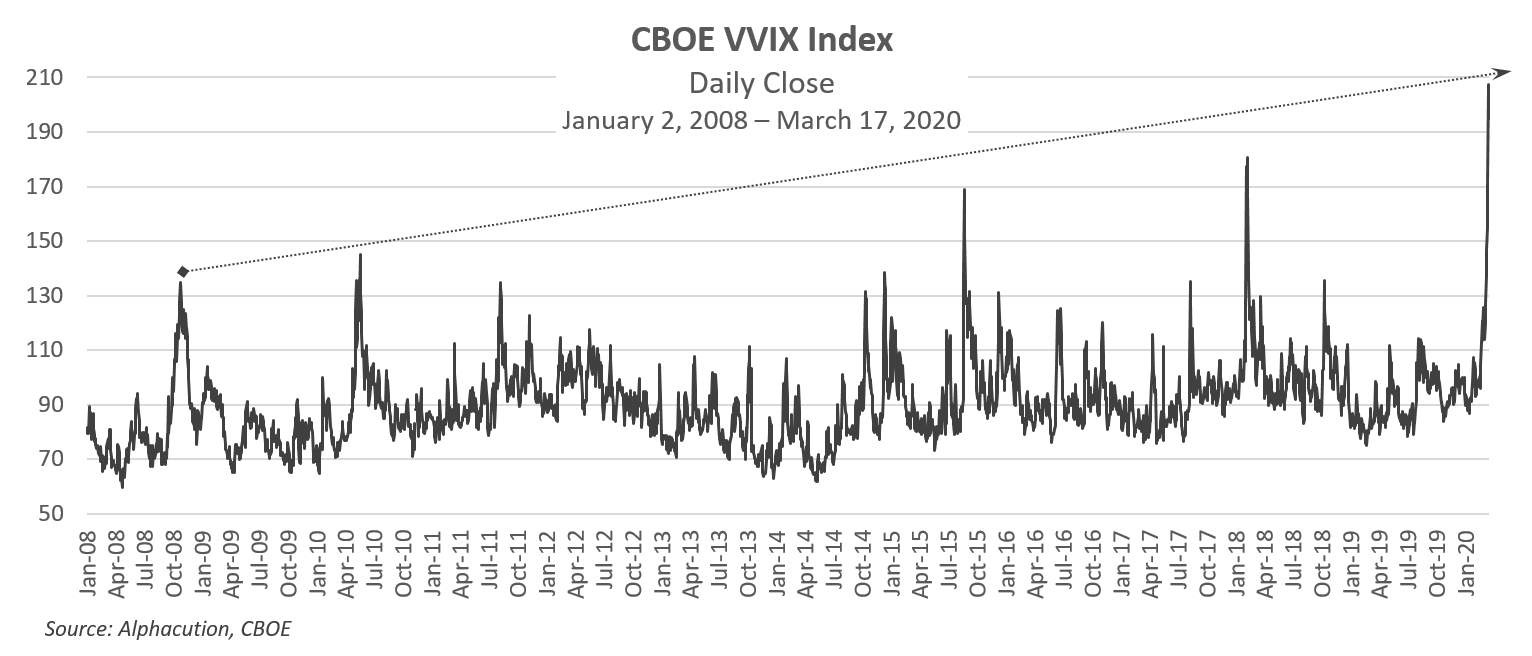
Moreover, the bottom chart – a time series of 1-day changes in daily VIX closes – truly illustrates the earthquake-like reaction the market has had to the CVP flow of news relative to other turbulent periods of the GFC era. In fact, the all-time-high volatility of volatility index (VVIX) reading for March 2020, below, makes ~October 2008 look more like a foothill…
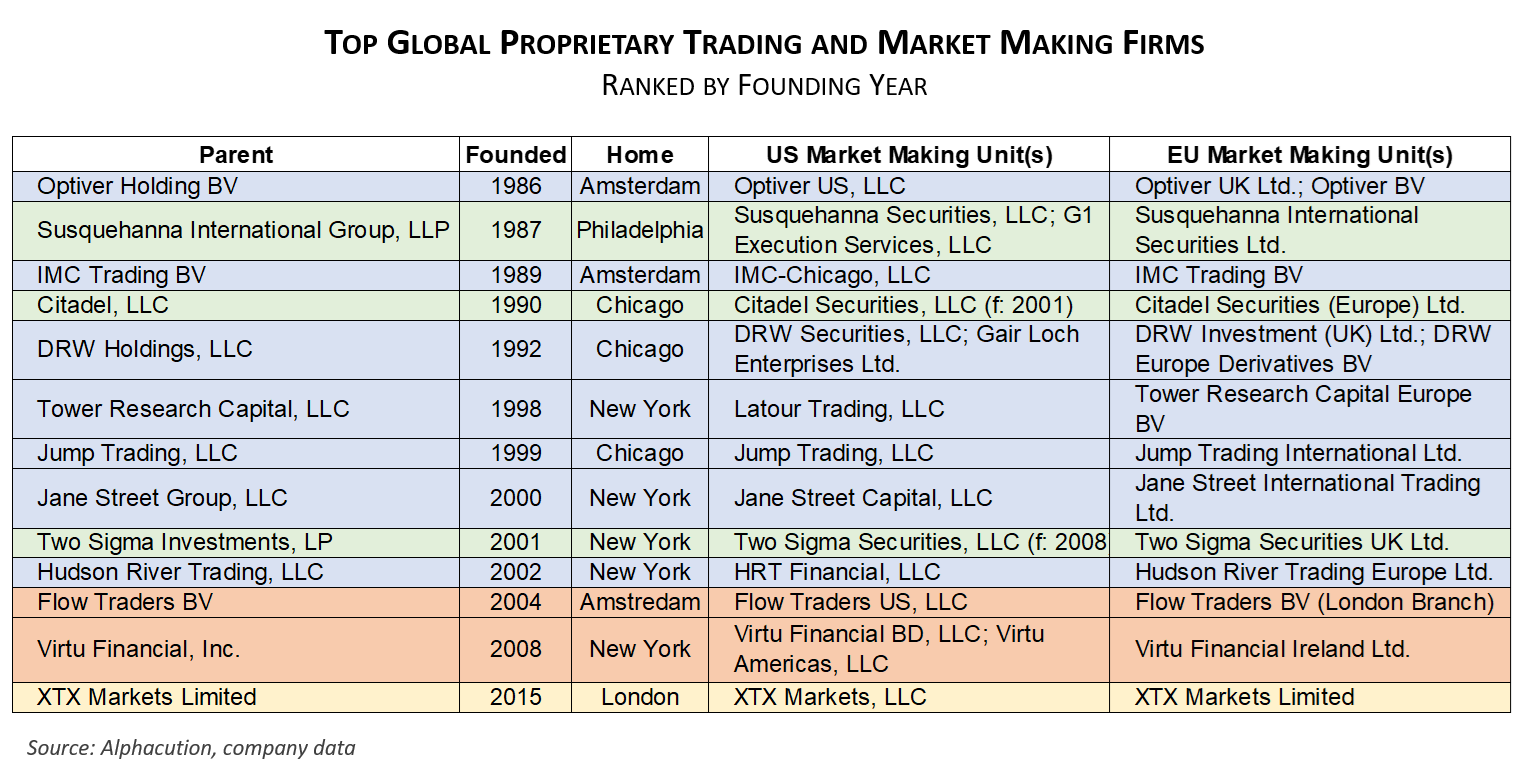
If there are any early silver linings to be found in the economic challenges, human impacts and sheer uncertainty represented by this data, it may be found in the fortunes of market makers, proprietary trading firms, and active quantitative trading strategies – as well as the resilience of the market’s listed liquidity venues themselves. Because, so far and with few minor exceptions, public markets – and the players that live and sometimes thrive in our structural alpha zone – have successfully absorbed the volumes and the volatility; a point that brings us to this:
In a recent Feed post updating the components of net trading income (NTI) for Virtu, we presented the following chart. The purpose of presenting it again, here, is not so much to re-emphasize Virtu’s historical performance, but to illustrate the relationship between performance and volatility in a way that can’t be done for many other firms in this area of the ecosystem, save for Flow Traders (second chart below). These are examples of surprise spikes in volatility – when realized vol exceeds implied vol, like in Q1 2018 (based on a few high-vol days in early Feb of that year) – where automated, high-frequency market making programs tend to do well…
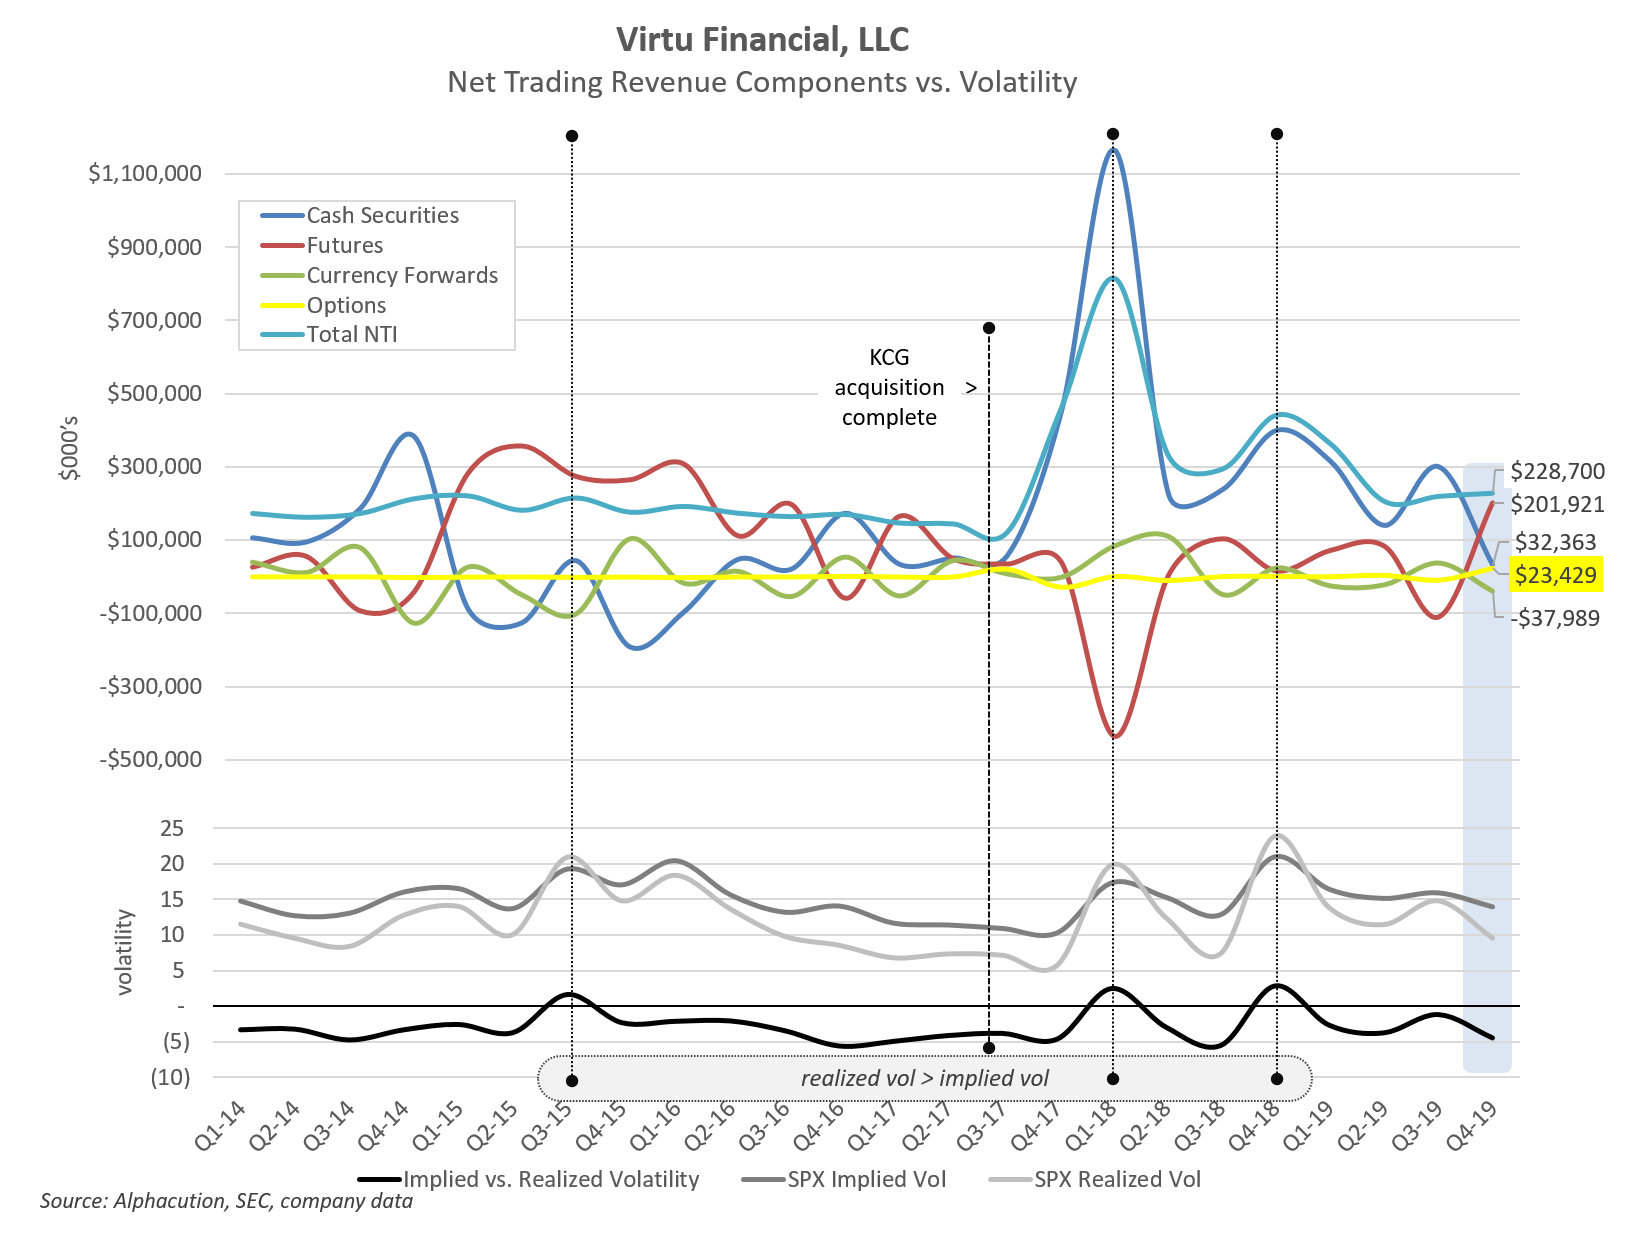
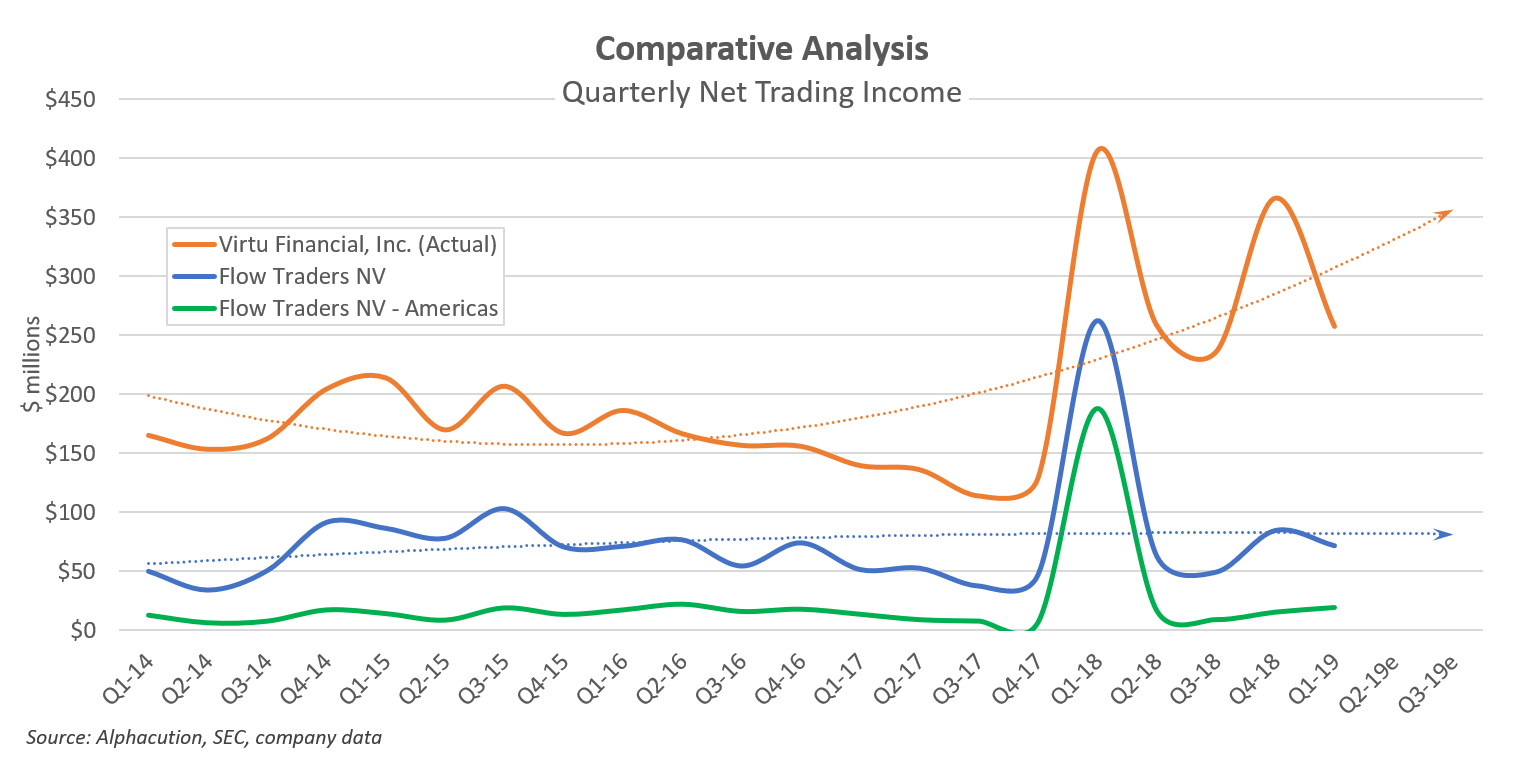
These charts set up a more focused comparison of the recent historical spike in volumes and volatility (from Q1 2018) with that of the emerging CVP period where Alphacution presents some of the prior data for the 806 trading days beginning Jan 3, 2017 and ending yesterday, Mar 17, 2020, below. Based on these pictures (and what little we know about what is yet to come), it appears that we can expect a longer period of elevated option volumes and violent volatility shifts…
With that, the following list of leading prop trading and market making firms should be among those that do well in this unusual environment…
Until next time, please stay safe…